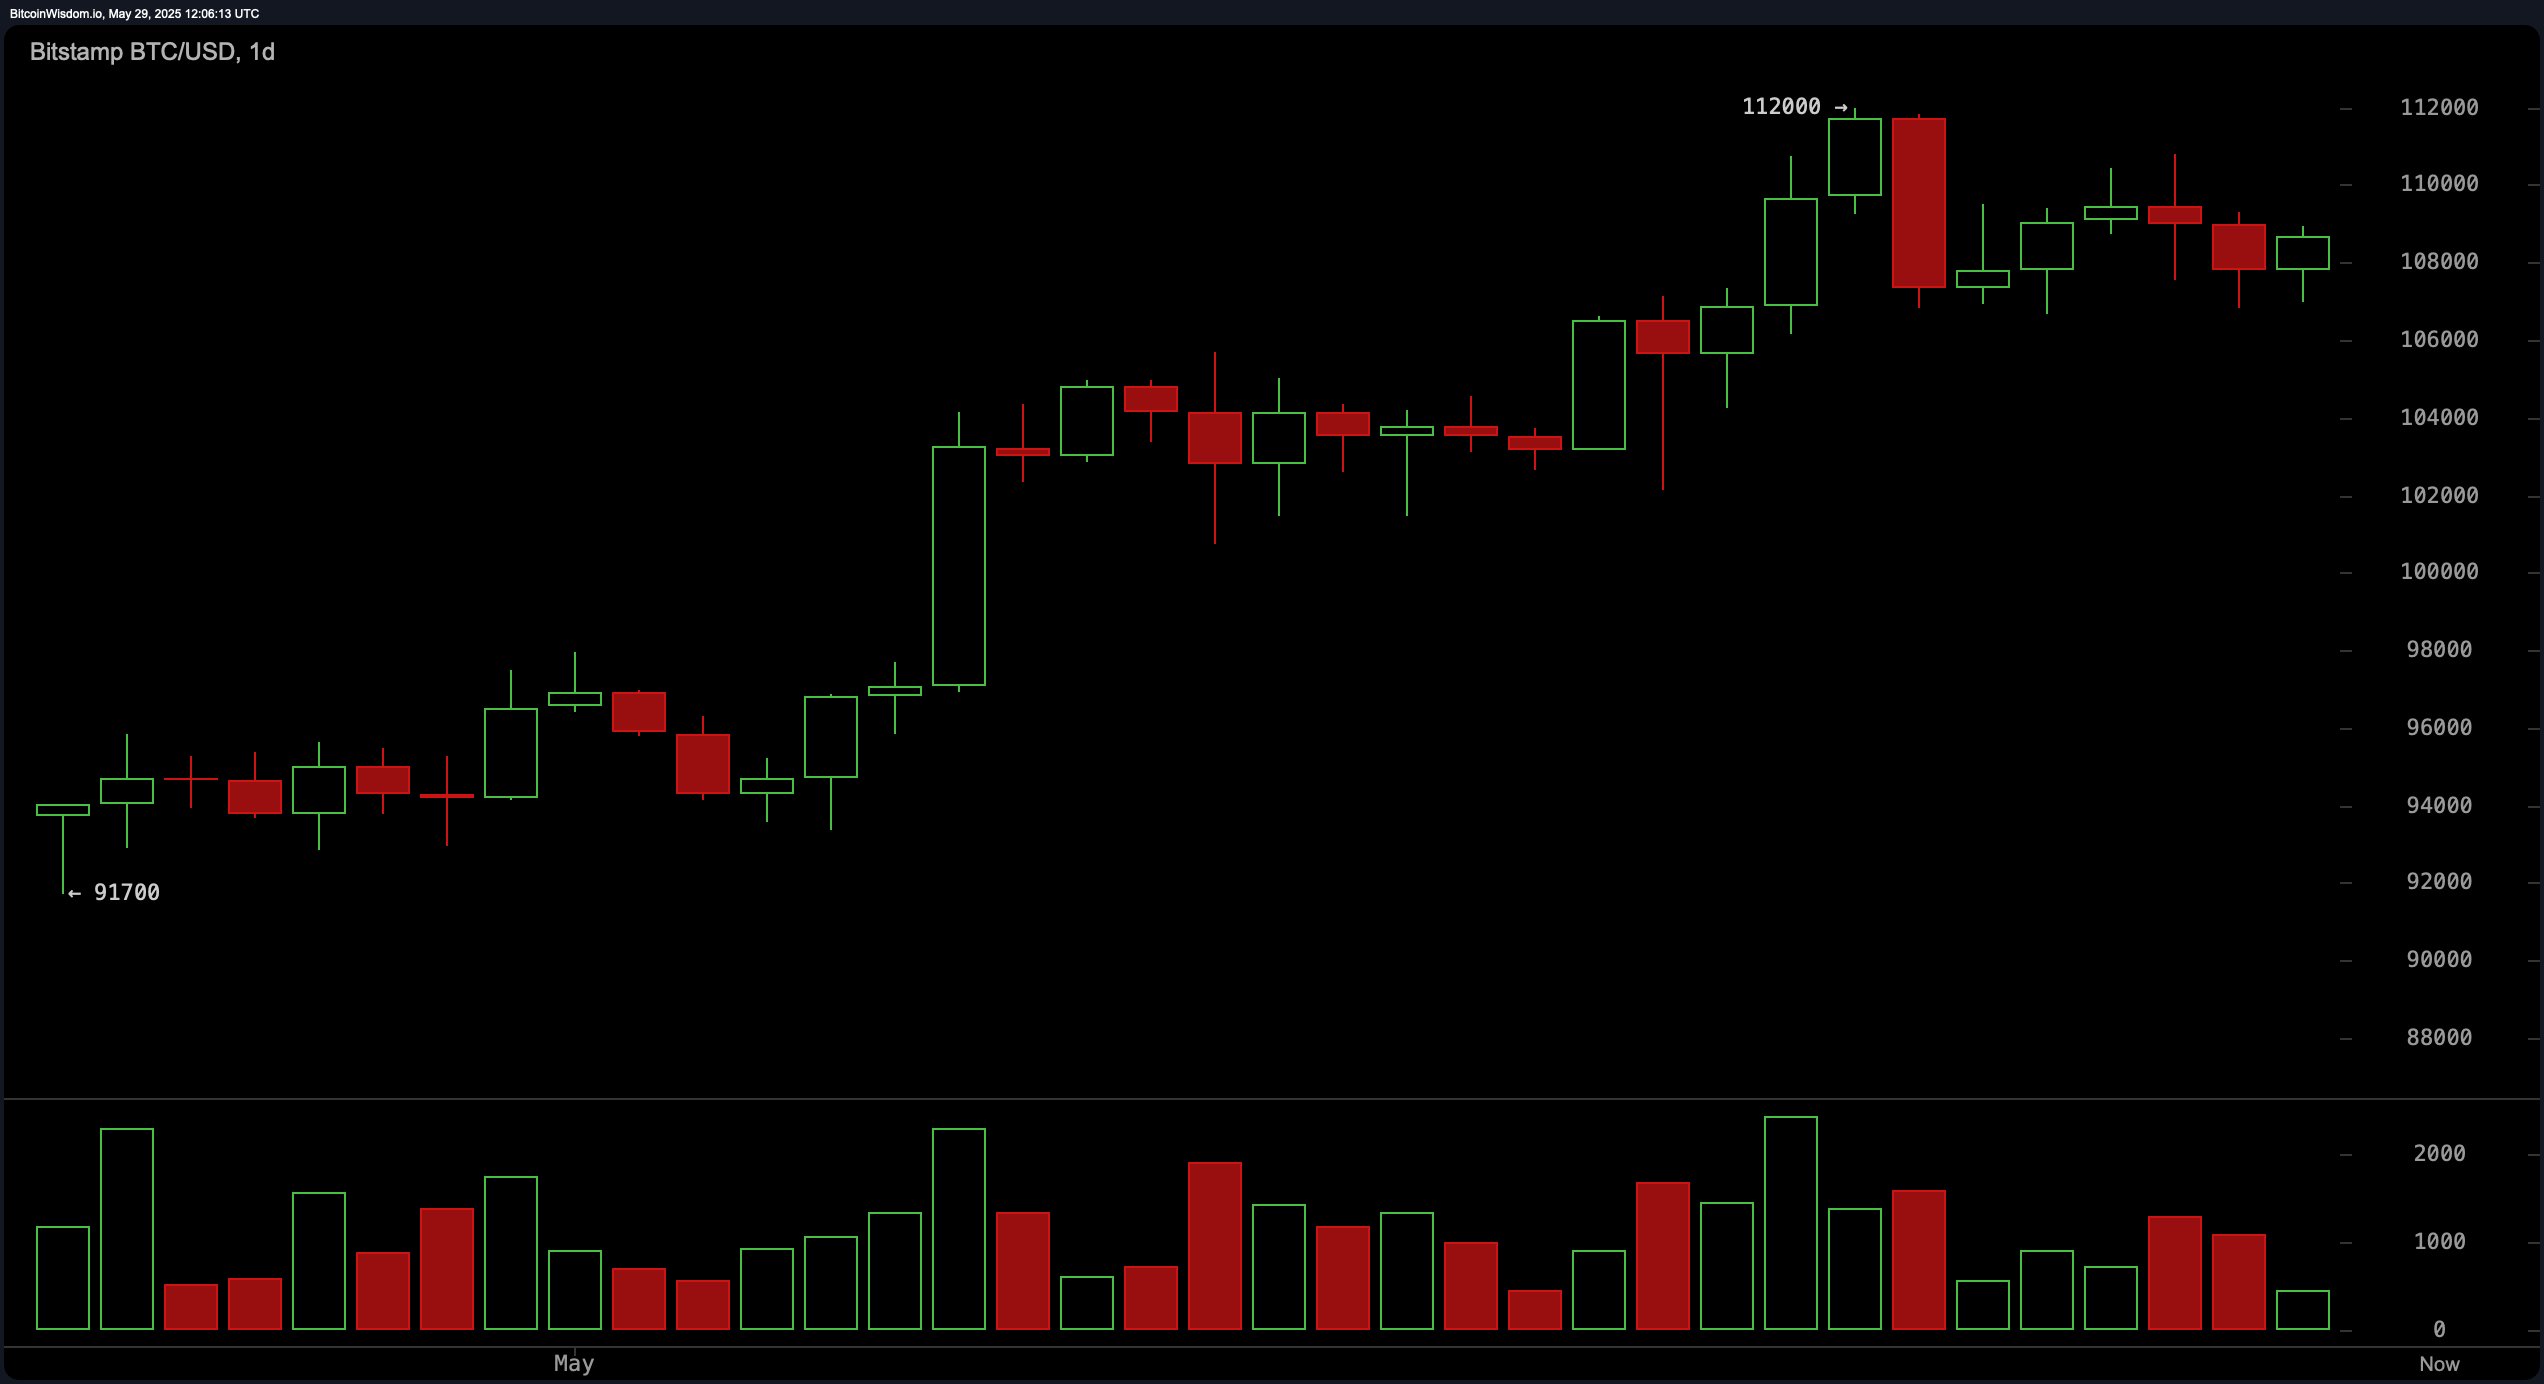
Ah, the daily chart! It reveals that our beloved Bitcoin is clinging to an uptrend that began near the humble $91,700. Yet, as the candles flicker like the last embers of a dying fire, we see signs of a waning bullish momentum after a peak that flirted with $112,000. The price action around $108,000 to $109,000 is like a shy child at a party—hesitant and lacking the enthusiasm to join the fun. A dominant red candle, followed by smaller, indecisive candles, paints a picture of uncertainty. For those brave swing traders, the $105,000–$106,000 zone is a historical treasure trove, while resistance lurks ominously near $111,000–$112,000. A break above or a rejection at these levels could very well dictate our near-term fate.