Bitcoin price stands at $82,193, with a market cap of $1.64 trillion and a 24-hour trading volume of $25.35 billion, as it navigates a volatile intraday range of $82,140 to $85,503, reflecting bearish momentum across multiple timeframes.
Bitcoin: Between Optimism and Doom
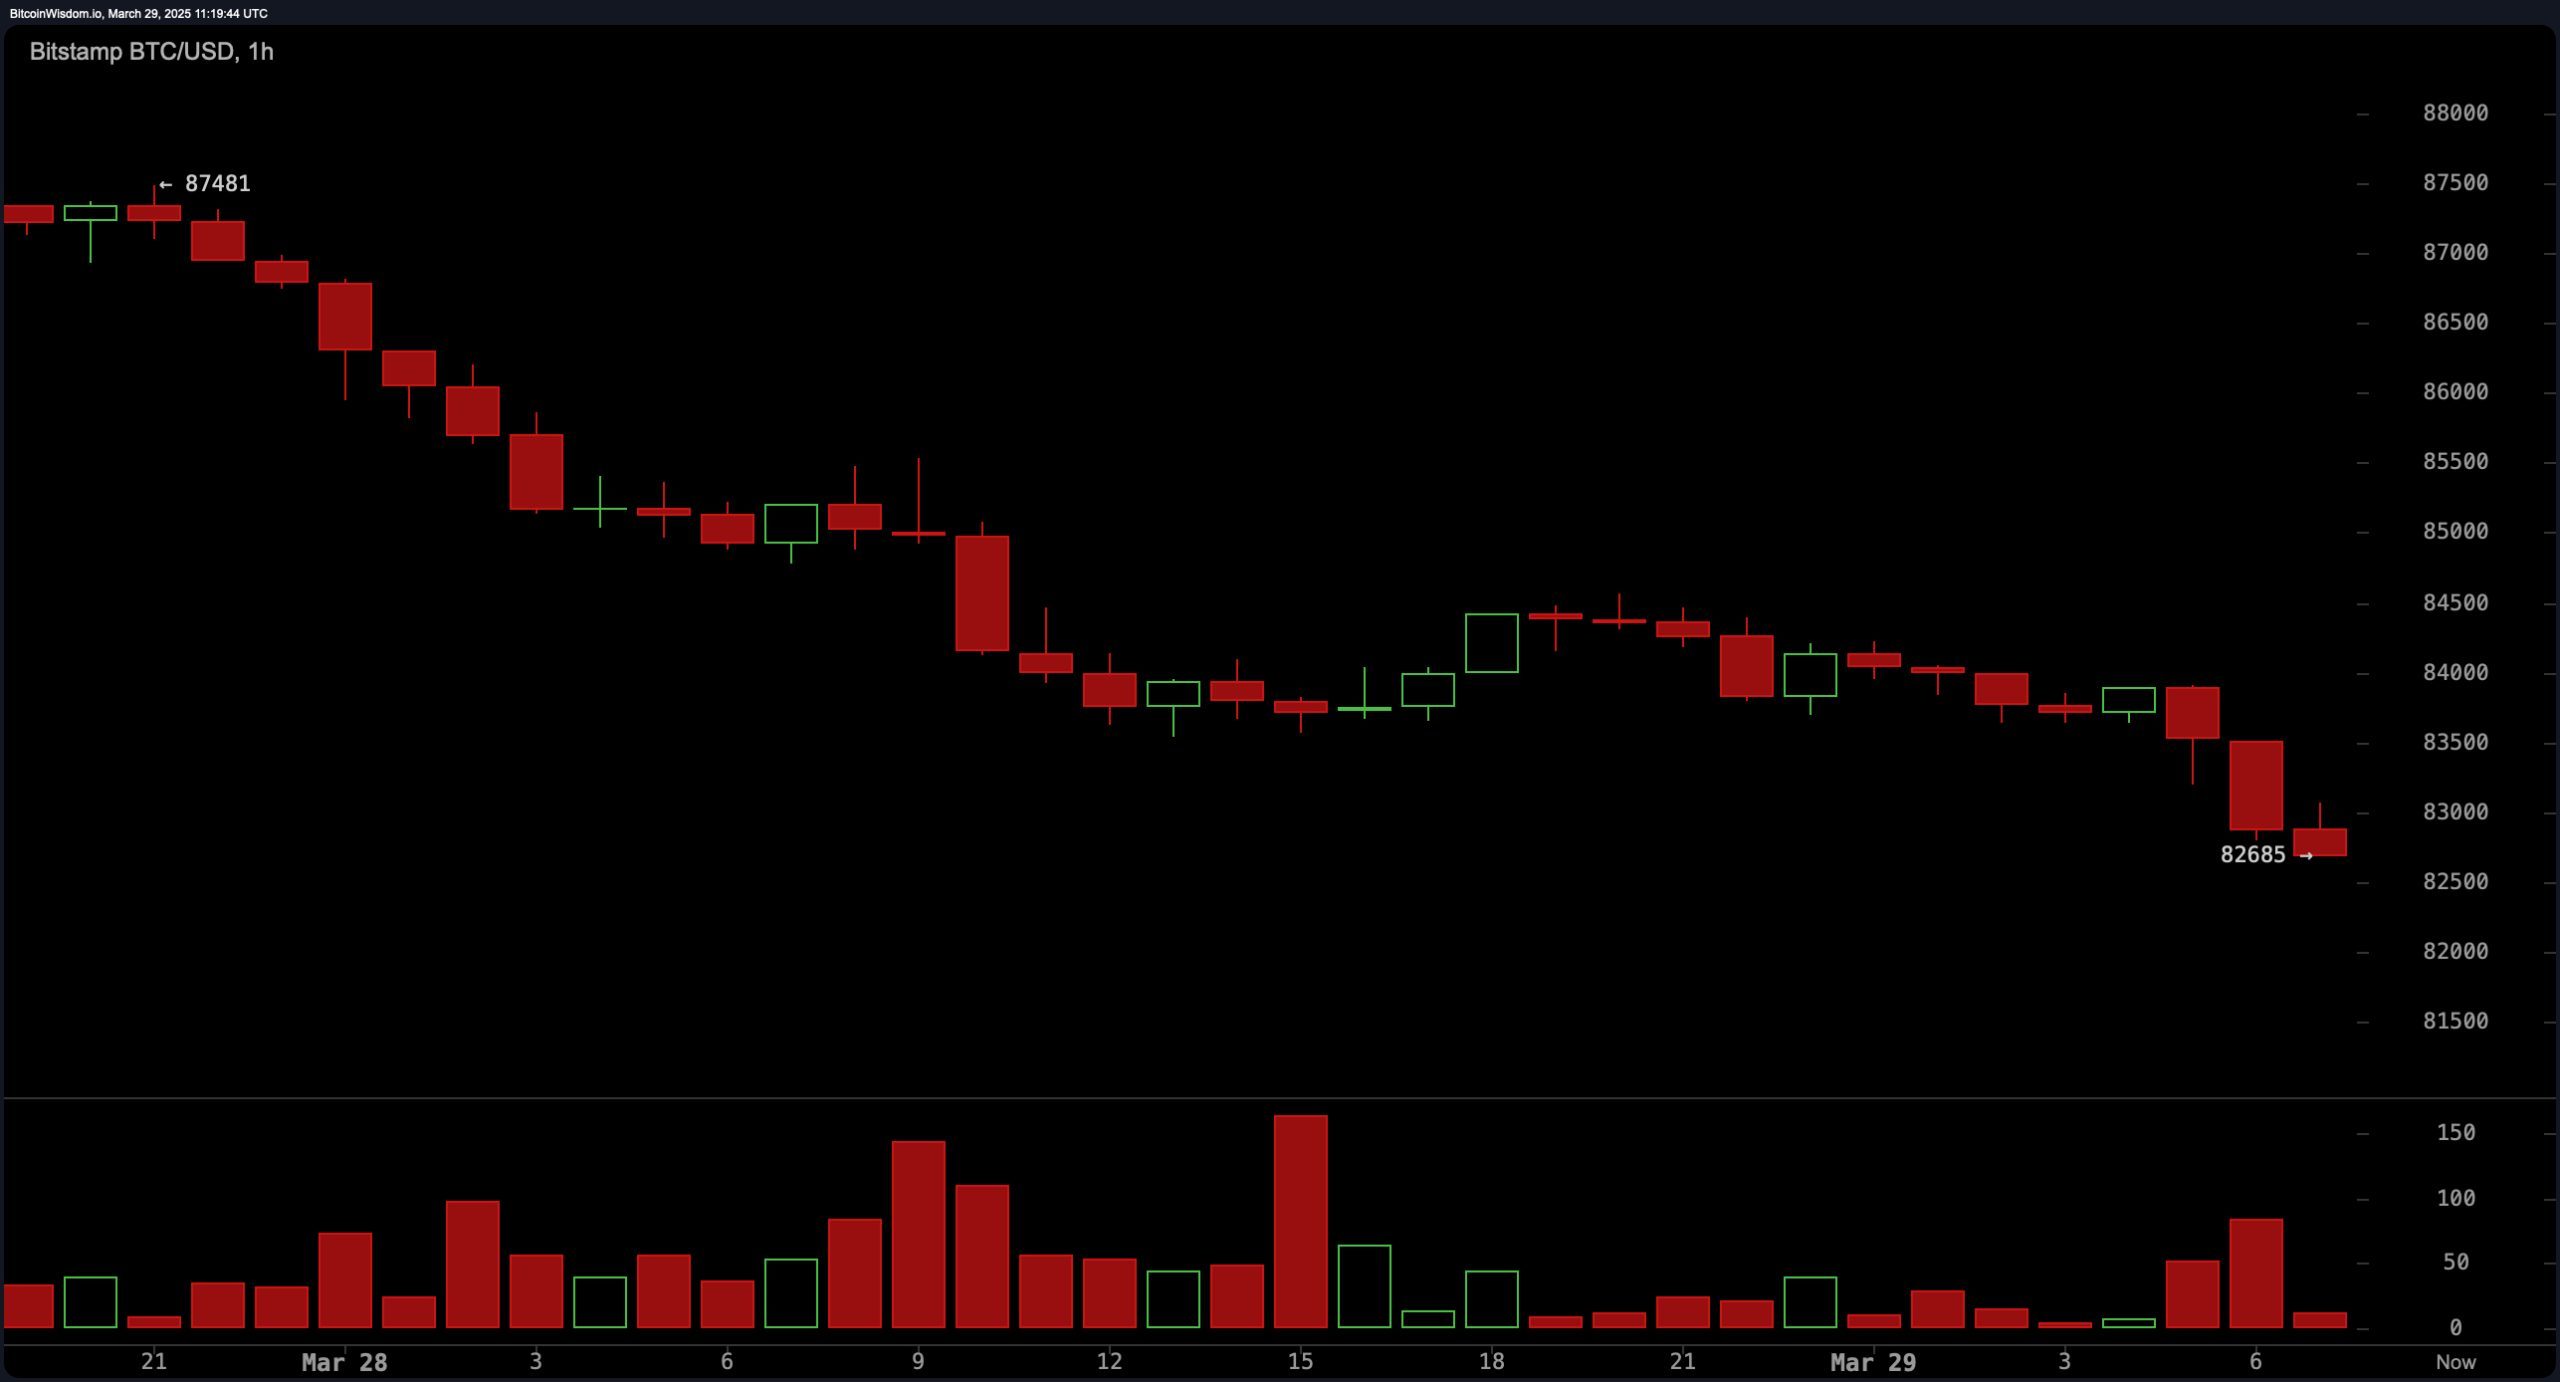
On the 1-hour chart, bitcoin’s downward tumble resembles a tragic drama befitting Greek myths. From its lofty heights at $87,481, it now limps in retreat, the victim of mounting selling pressure. 📉 Volume spikes during declines add insult to injury, mercilessly confirming a bearish undertone. Support clings on at $82,000 like a poor soul at the edge of a cliff, while resistance at $84,000 sneers from above, daring traders to make their move. Short the rebounds, they whisper. But watch out — a bounce above $84,000 might just ruin your plans like an ill-timed plot twist in a B-grade thriller.

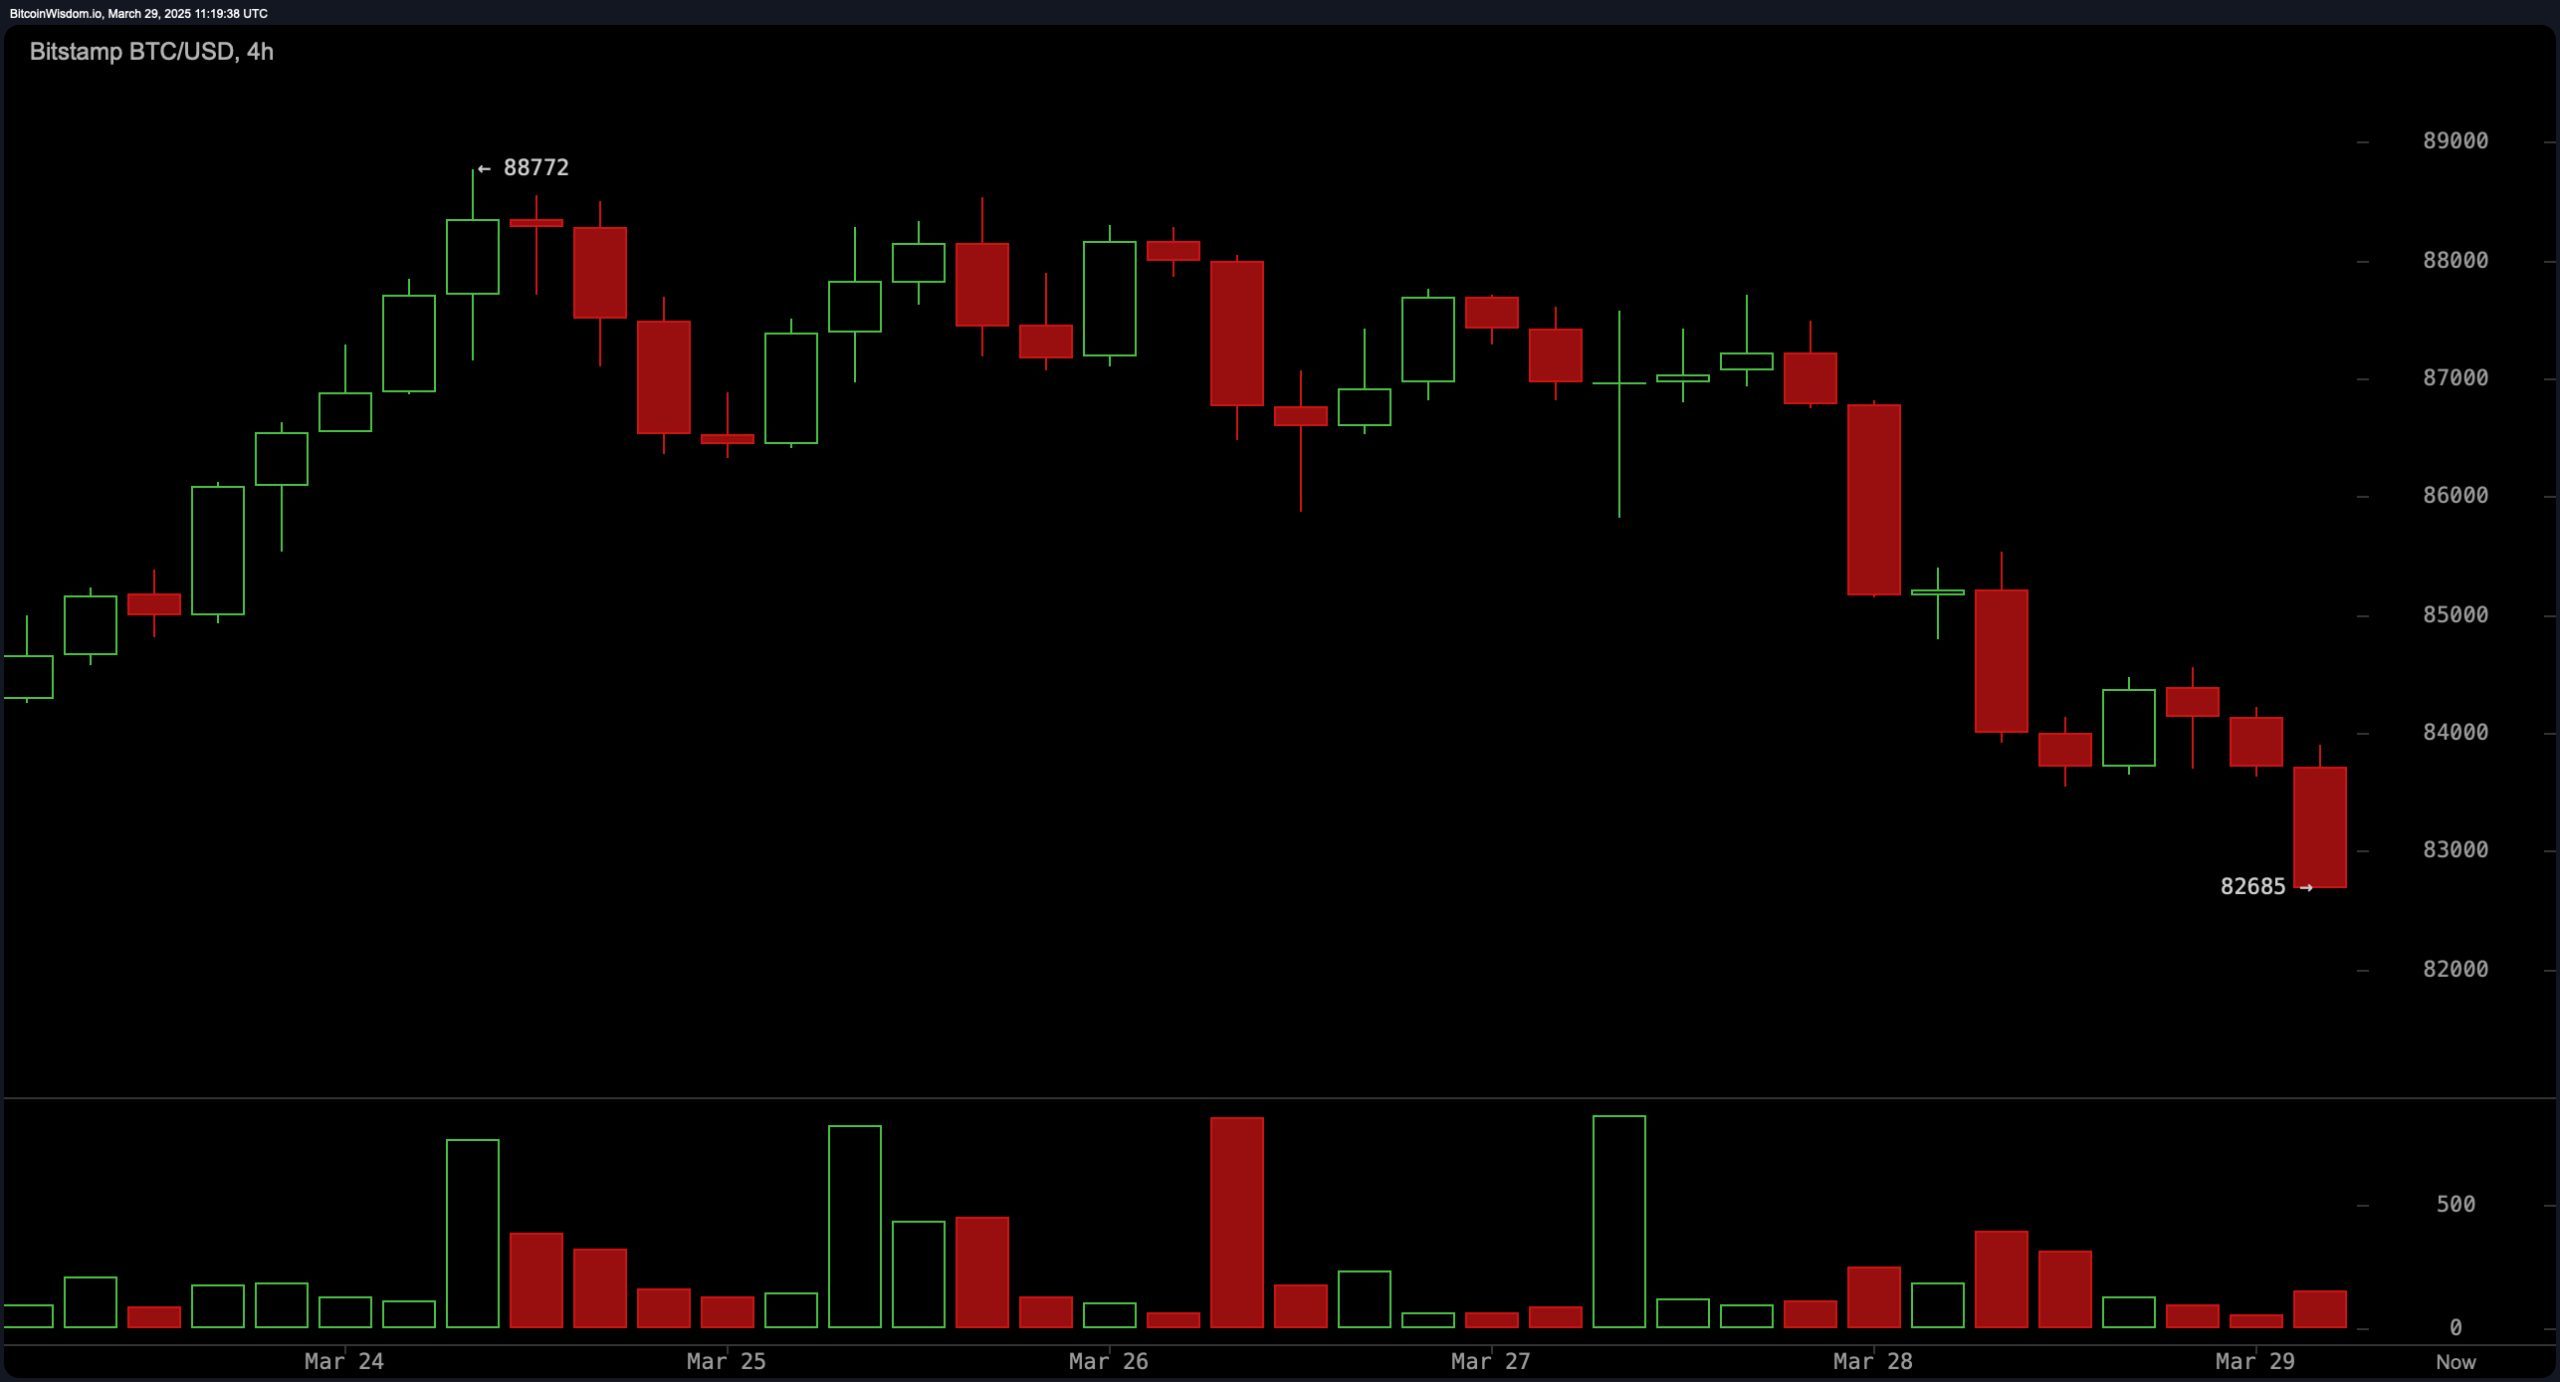
On the 4-hour chart, bitcoin continues its audition as the protagonist in a cautionary tale of greed and hubris. Having slid down from $88,772, it’s now writing lower highs and lower lows in bold ink across your portfolio. Resistance plays hide-and-seek between $85,000 and $86,000, while support grumbles and shuffles at $82,000. High-volume red candles glare ominously, warning of imminent doom. Could a hero emerge from the ashes and reclaim $86,000 to shift this Shakespearean tragedy into a comedy? Unlikely, but funnier things have happened. 🤷♀️

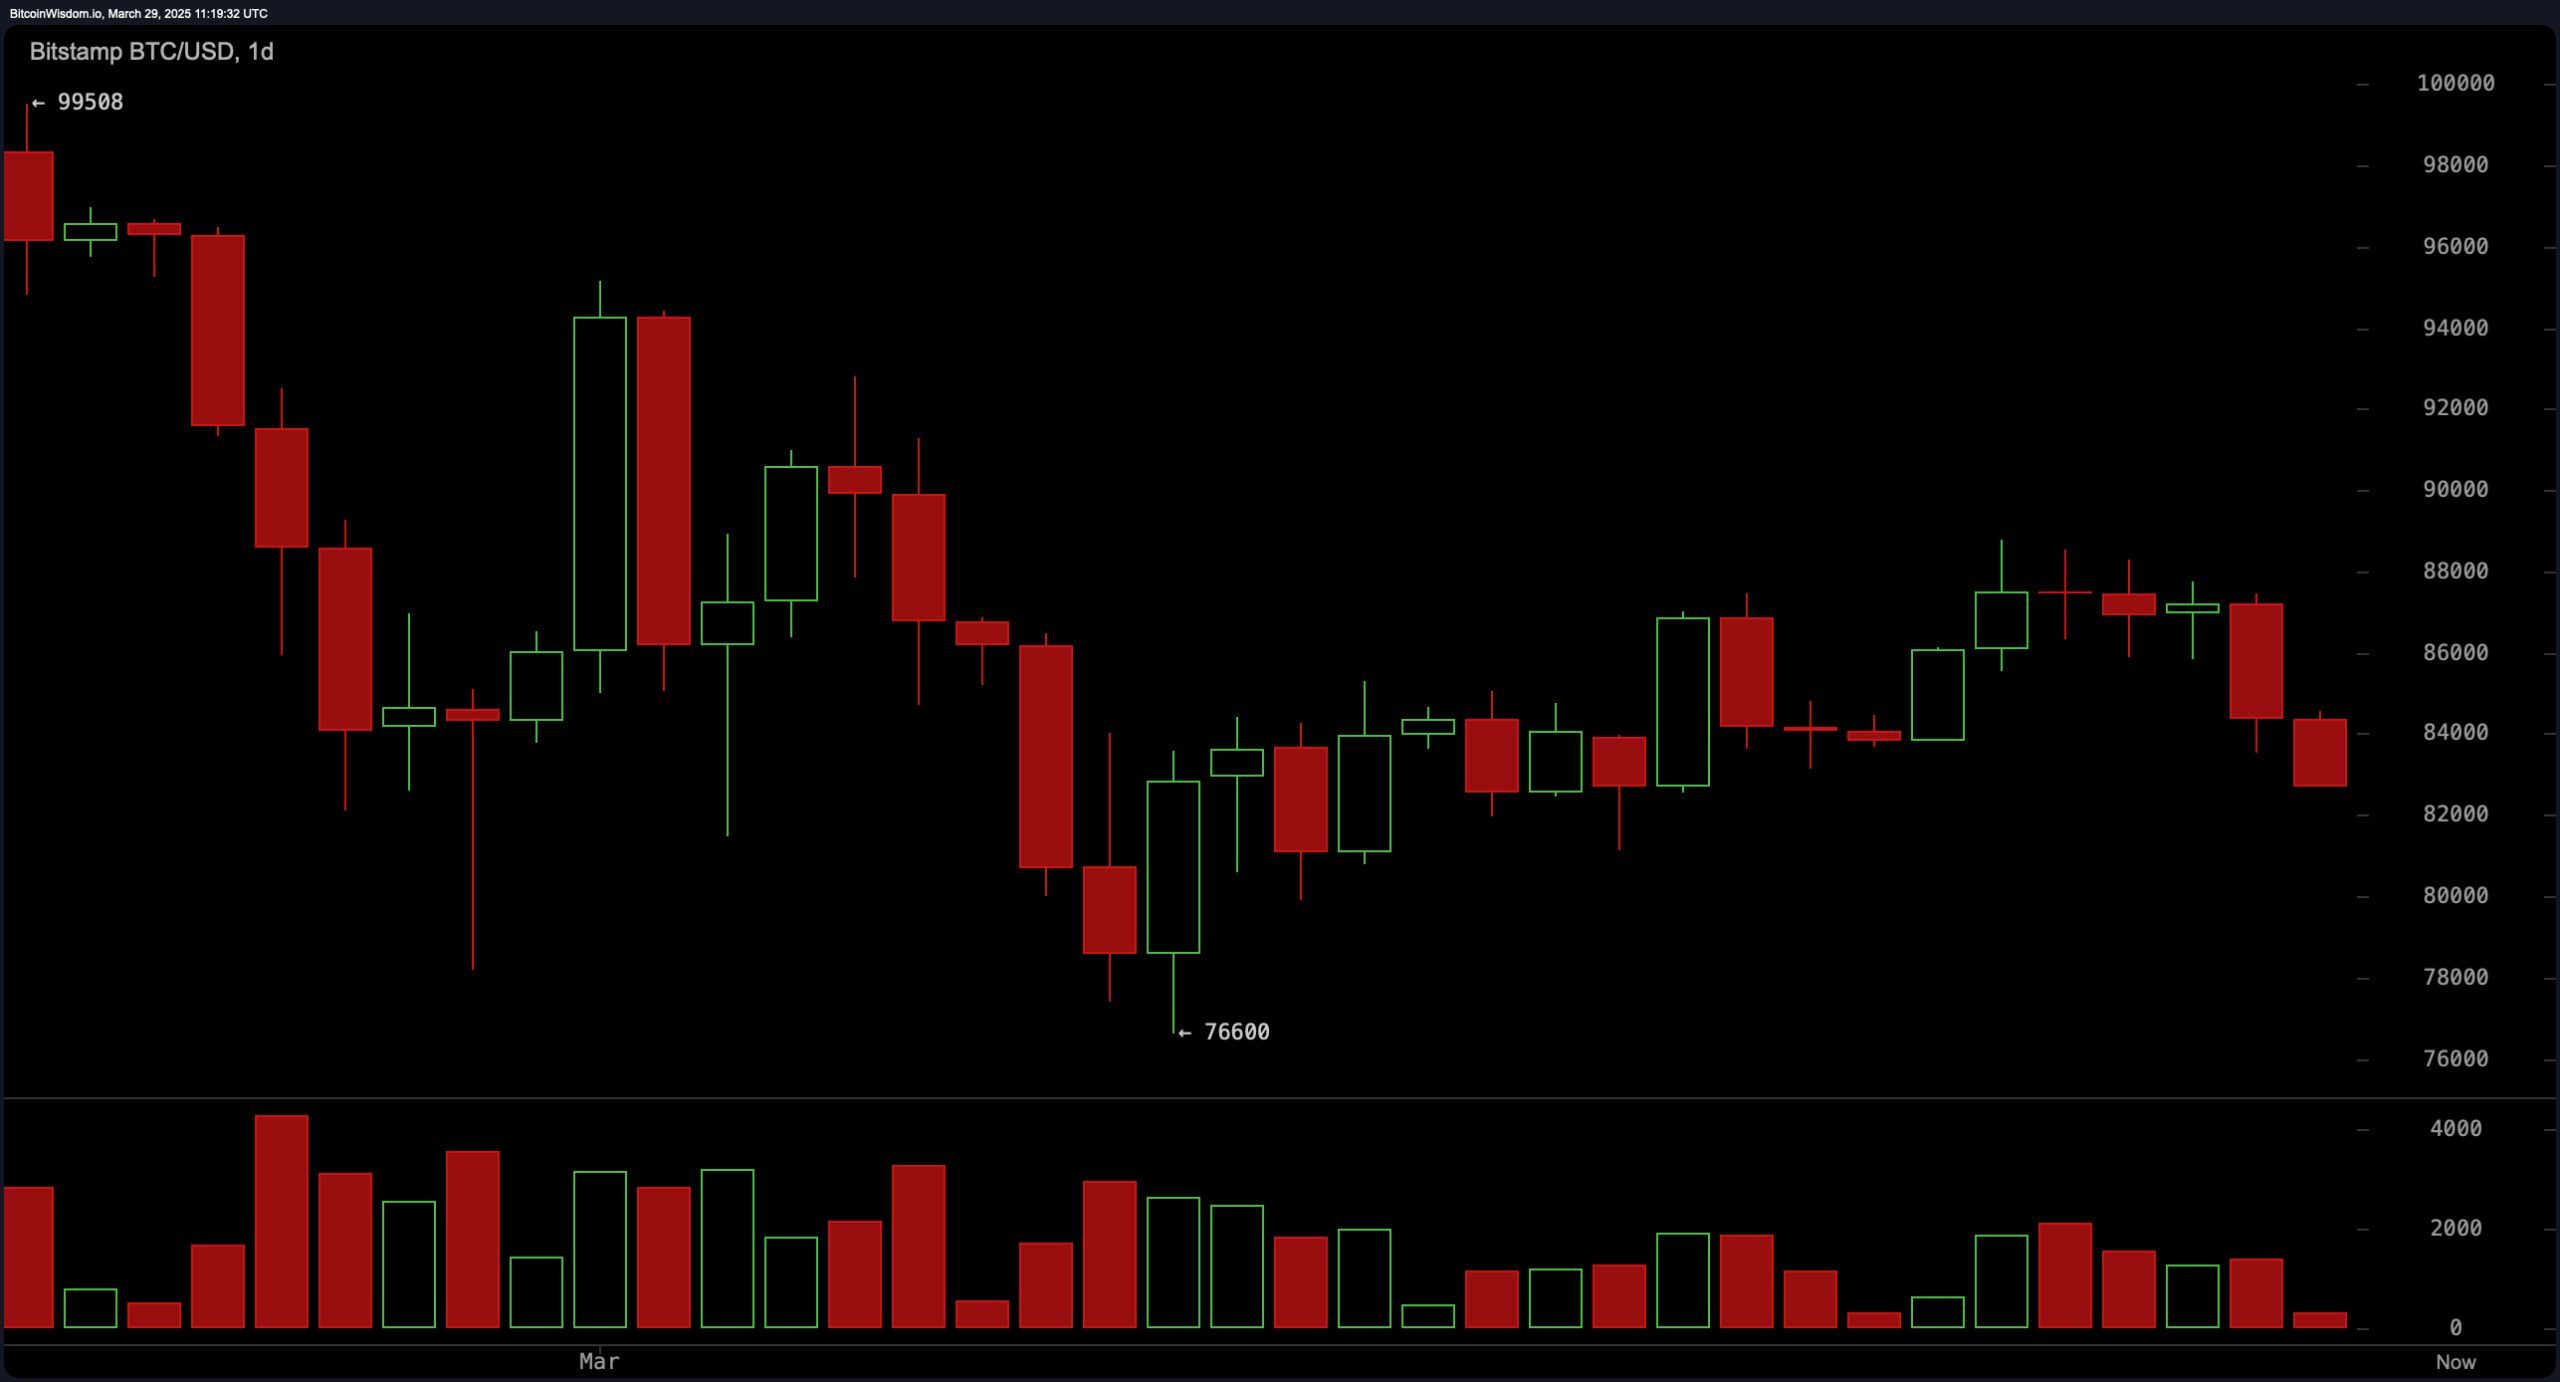
On the daily chart, bitcoin’s long and painful descent suggests someone accidentally hit the self-destruct button at $99,508. Support at $76,600 clutches on like your last remaining dollar at a Vegas slot machine, while resistance between $88,000 to $90,000 looms large, mocking any attempts at recovery. 💰 Red candles flash aggressively — sellers evidently think the stage is theirs. If bitcoin can muster the courage (and volume!) to decisively break $90,000, traders may finally crack a smile… Or at least a sarcastic chuckle. Otherwise, pack some tissues and brace yourself for further heartbreak.

Indicators politely suggest bitcoin might want to take the weekend off. With the RSI at a yawn-inducing 43, Stochastic muddling through at 49, and CCI at -32 (ouch), enthusiasm is clearly on life support. The ADX at 23 barely notices its existence, while the awesome oscillator, true to its sarcastic name, does absolutely nothing. Meanwhile, the momentum indicator at -3,954 screams “downward pressure,” while the MACD is buying like it’s snagged a doorbuster deal at a crypto Black Friday sale.
Moving averages join the pity parade, with every timeframe unanimously pointing fingers at bitcoin and yelling, “SELL!” 🙅♂️ The EMA (10) at $85,196 and SMA (10) at $85,446 are the loudest voices in the choir of doom. Long-term averages like the SMA (200) at $85,809 echo the sentiment — no happy endings here, folks, unless buying interest magically materializes. Maybe try waving a wand or summoning Gandalf? 🪄
Fibonacci retracement charts outline the battlefield like generals planning their next futile assault. The daily chart bullies bitcoin below the 50% retracement level at $88,054, pushing it ever closer to the abyss. On the 4-hour chart, resistance at $85,728 keeps bitcoin firmly in detention, while the 1-hour chart mocks its faint hopes with $84,517 at the 61.8% retracement level. Spoiler alert: Miss these marks, and bitcoin falls harder than a socialite’s reputation at a tabloid party. 🎭 Conversely, a breakout could bring redemption. (Cue dramatic music.)
Bull Verdict:
If bitcoin channels some heroic energy and bulldozes resistance at $85,000 and $86,000, fireworks could ensue! 🎆 A MACD buy signal whispers of greener pastures, while breaking above key Fibonacci levels might even trigger a mini champagne celebration. 🎉 Next targets: $88,000 to $90,000 — fingers crossed, toes crossed, and maybe even eyes crossed.
Bear Verdict:
The gloom is palpable, with downward momentum spreading like an embarrassing party rumor. Moving averages and oscillators shake their heads disapprovingly. Lower highs and lower lows on all charts spell trouble ahead — at this point, bitcoin looks like it needs a stiff drink. 🍸 A break below $82,685 could send it spiraling faster than you can say “crypto winter,” with losses plummeting toward $76,600. Hold on to your hats — the ride might not be over yet! 🎢
Read More
- Grimguard Tactics tier list – Ranking the main classes
- Silver Rate Forecast
- USD CNY PREDICTION
- 10 Most Anticipated Anime of 2025
- Black Myth: Wukong minimum & recommended system requirements for PC
- Former SNL Star Reveals Surprising Comeback After 24 Years
- Hero Tale best builds – One for melee, one for ranged characters
- Box Office: ‘Jurassic World Rebirth’ Stomping to $127M U.S. Bow, North of $250M Million Globally
- Gold Rate Forecast
- “Golden” Moment: How ‘KPop Demon Hunters’ Created the Year’s Catchiest Soundtrack
2025-03-29 15:01