As a seasoned trader with years of experience navigating the volatile world of cryptocurrencies, I find myself cautiously optimistic about Aave’s current position. While the upper band is acting as a resistance level and the RSI is hovering near the overbought territory, the MACD continues to grow and suggests increasing bullish momentum.
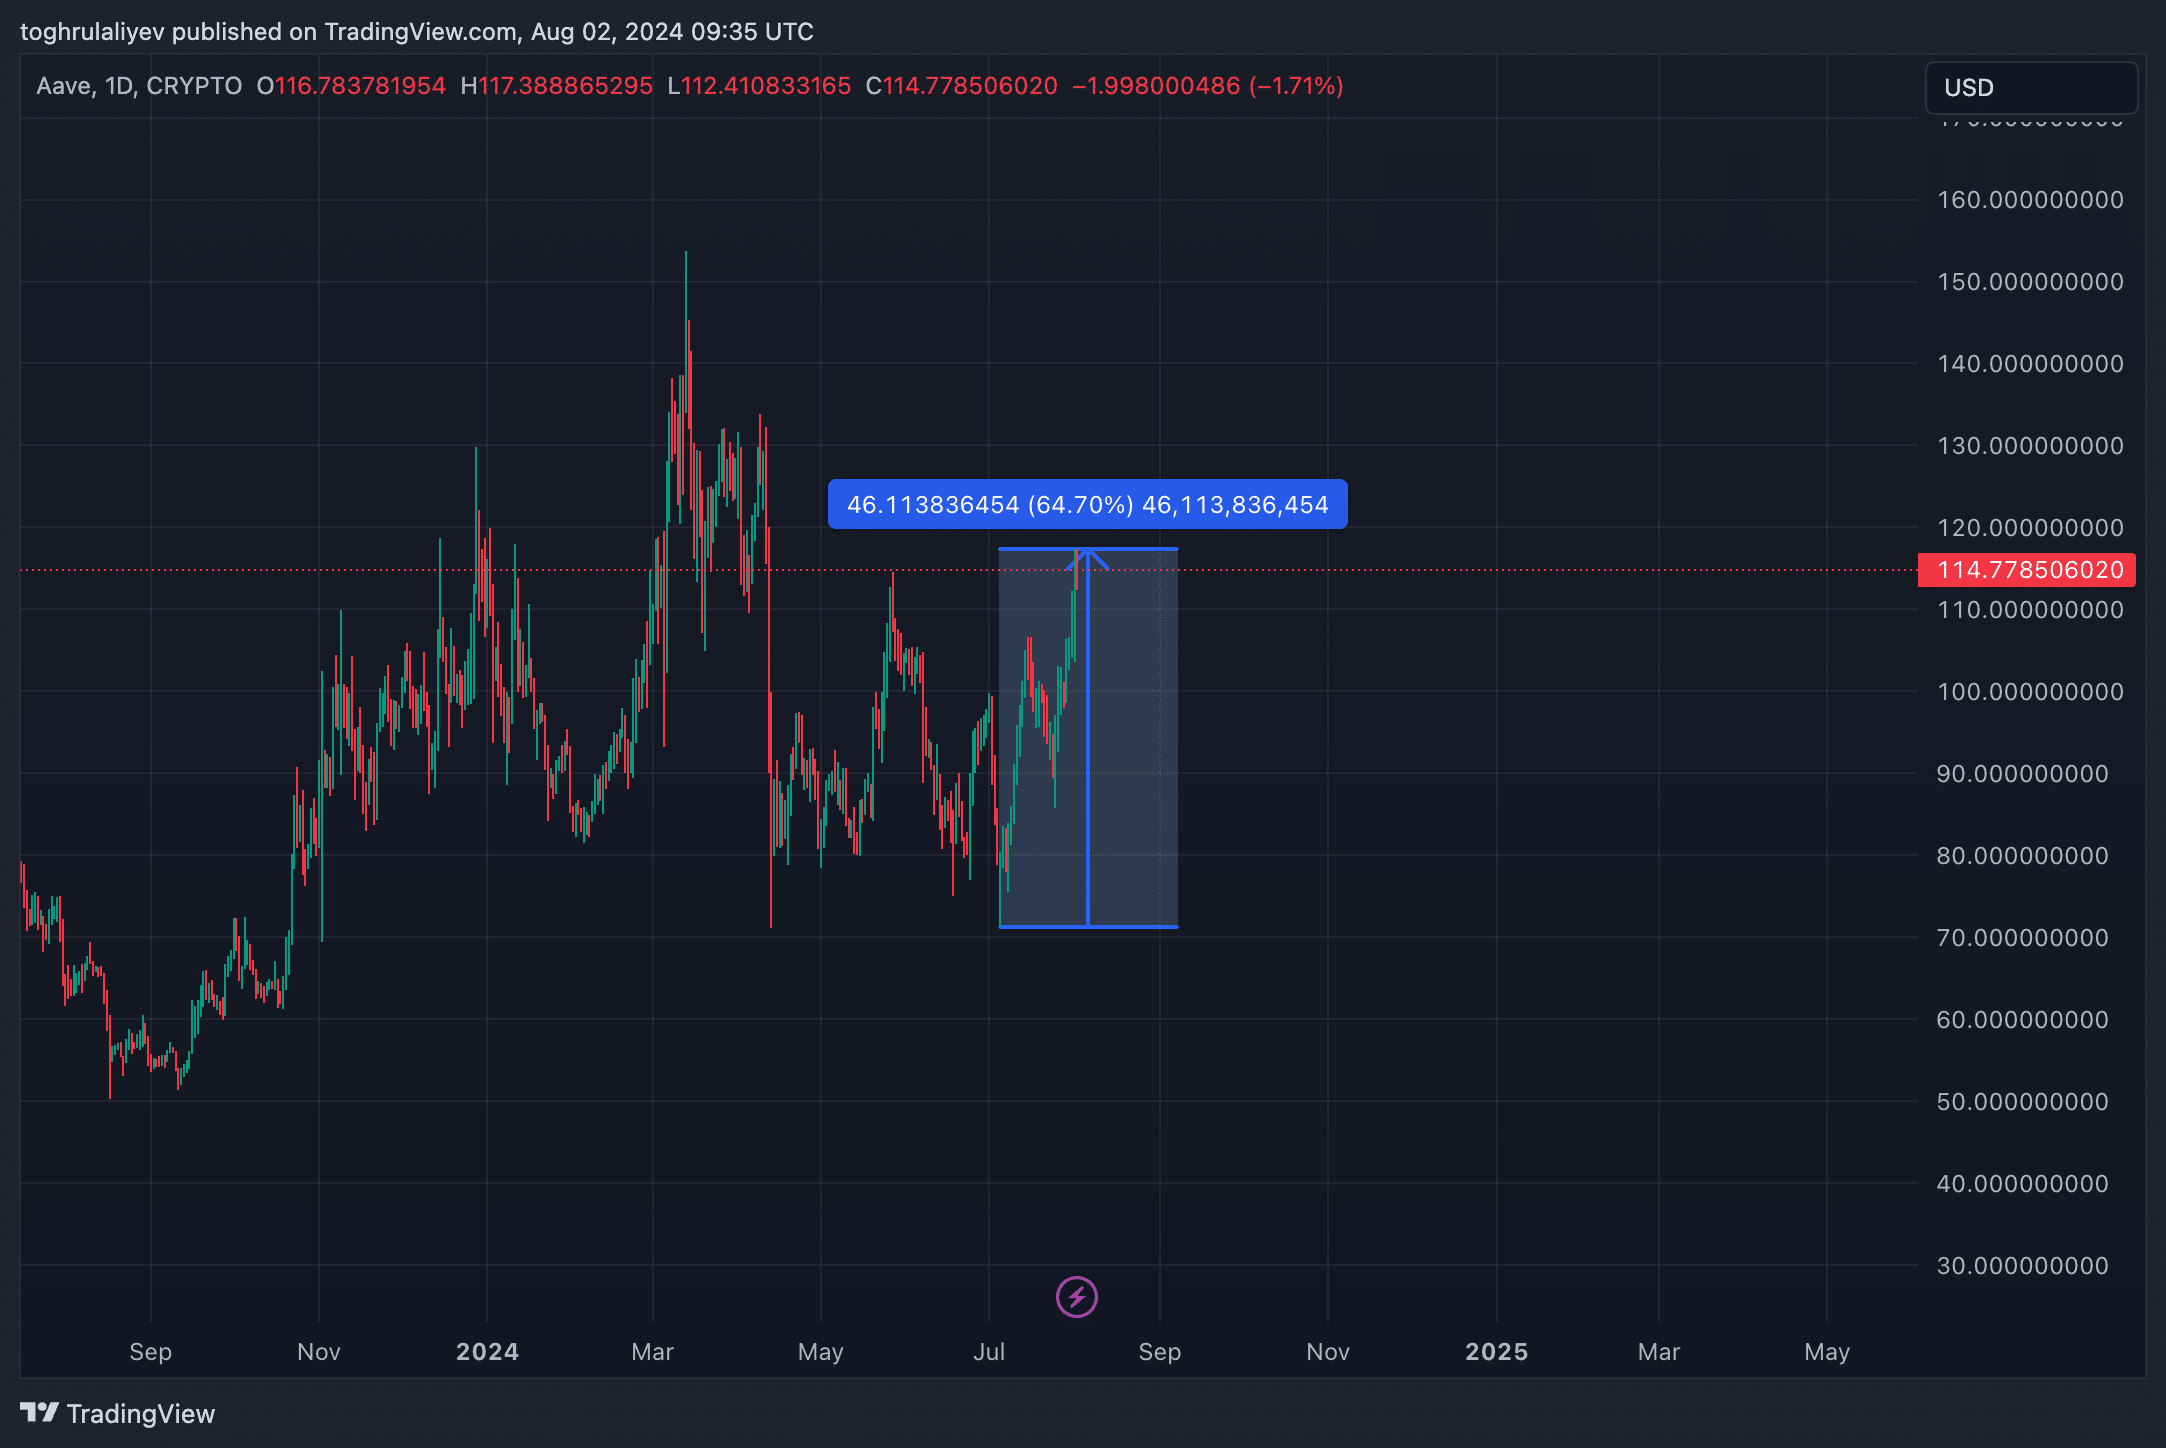
In just under a month, Aave (AAVE) has experienced a significant 64.7% increase. The current rally raises the question: will AAVE sustain its upward trajectory or is there a possibility of a reversal? This week’s discussion focuses on crucial technical markers, resistance points, and strategic factors to predict AAVE’s probable trend in the immediate future.
Table of Contents
Resistance and support analysis
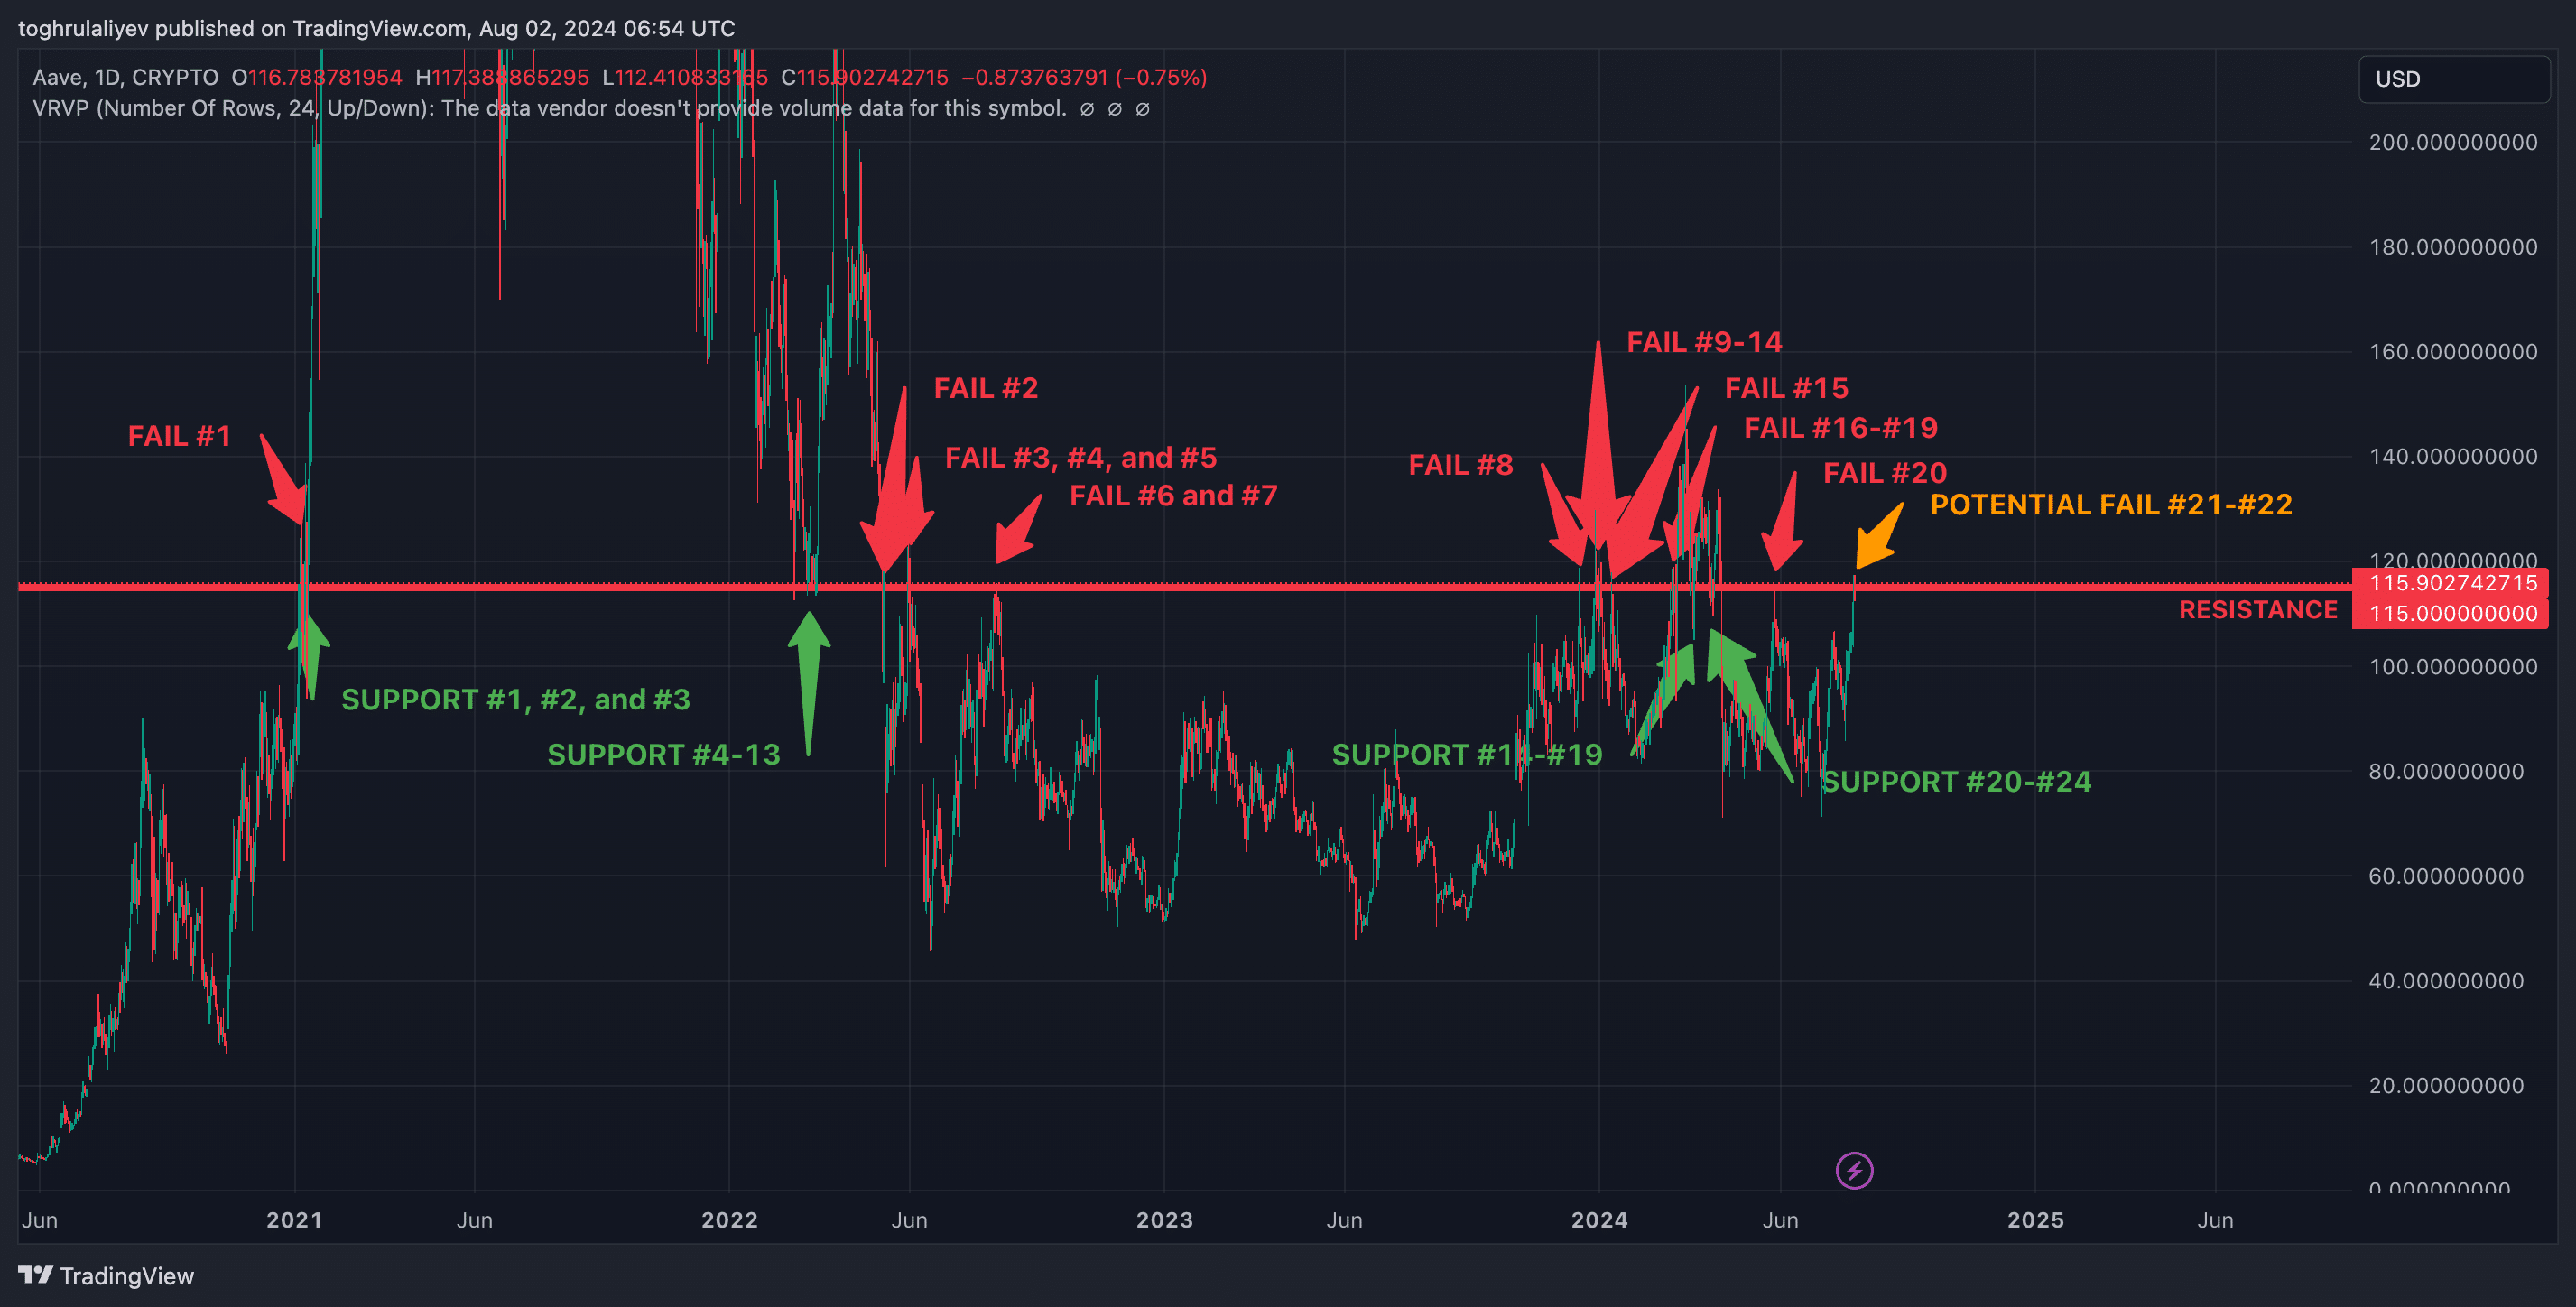
As Aave (AAVE) gets closer to the notable $115 price point, it finds itself at a crucial crossroads. This level holds considerable significance, having previously functioned as resistance on 20 occasions and support on 24 occasions in the past. The current market situation finds AAVE hovering near this pivotal mark, with traders eagerly awaiting whether it will meet resistance twice more or if it will finally surpass this threshold for the first time. However, indicators point towards a possible struggle to breach this barrier.
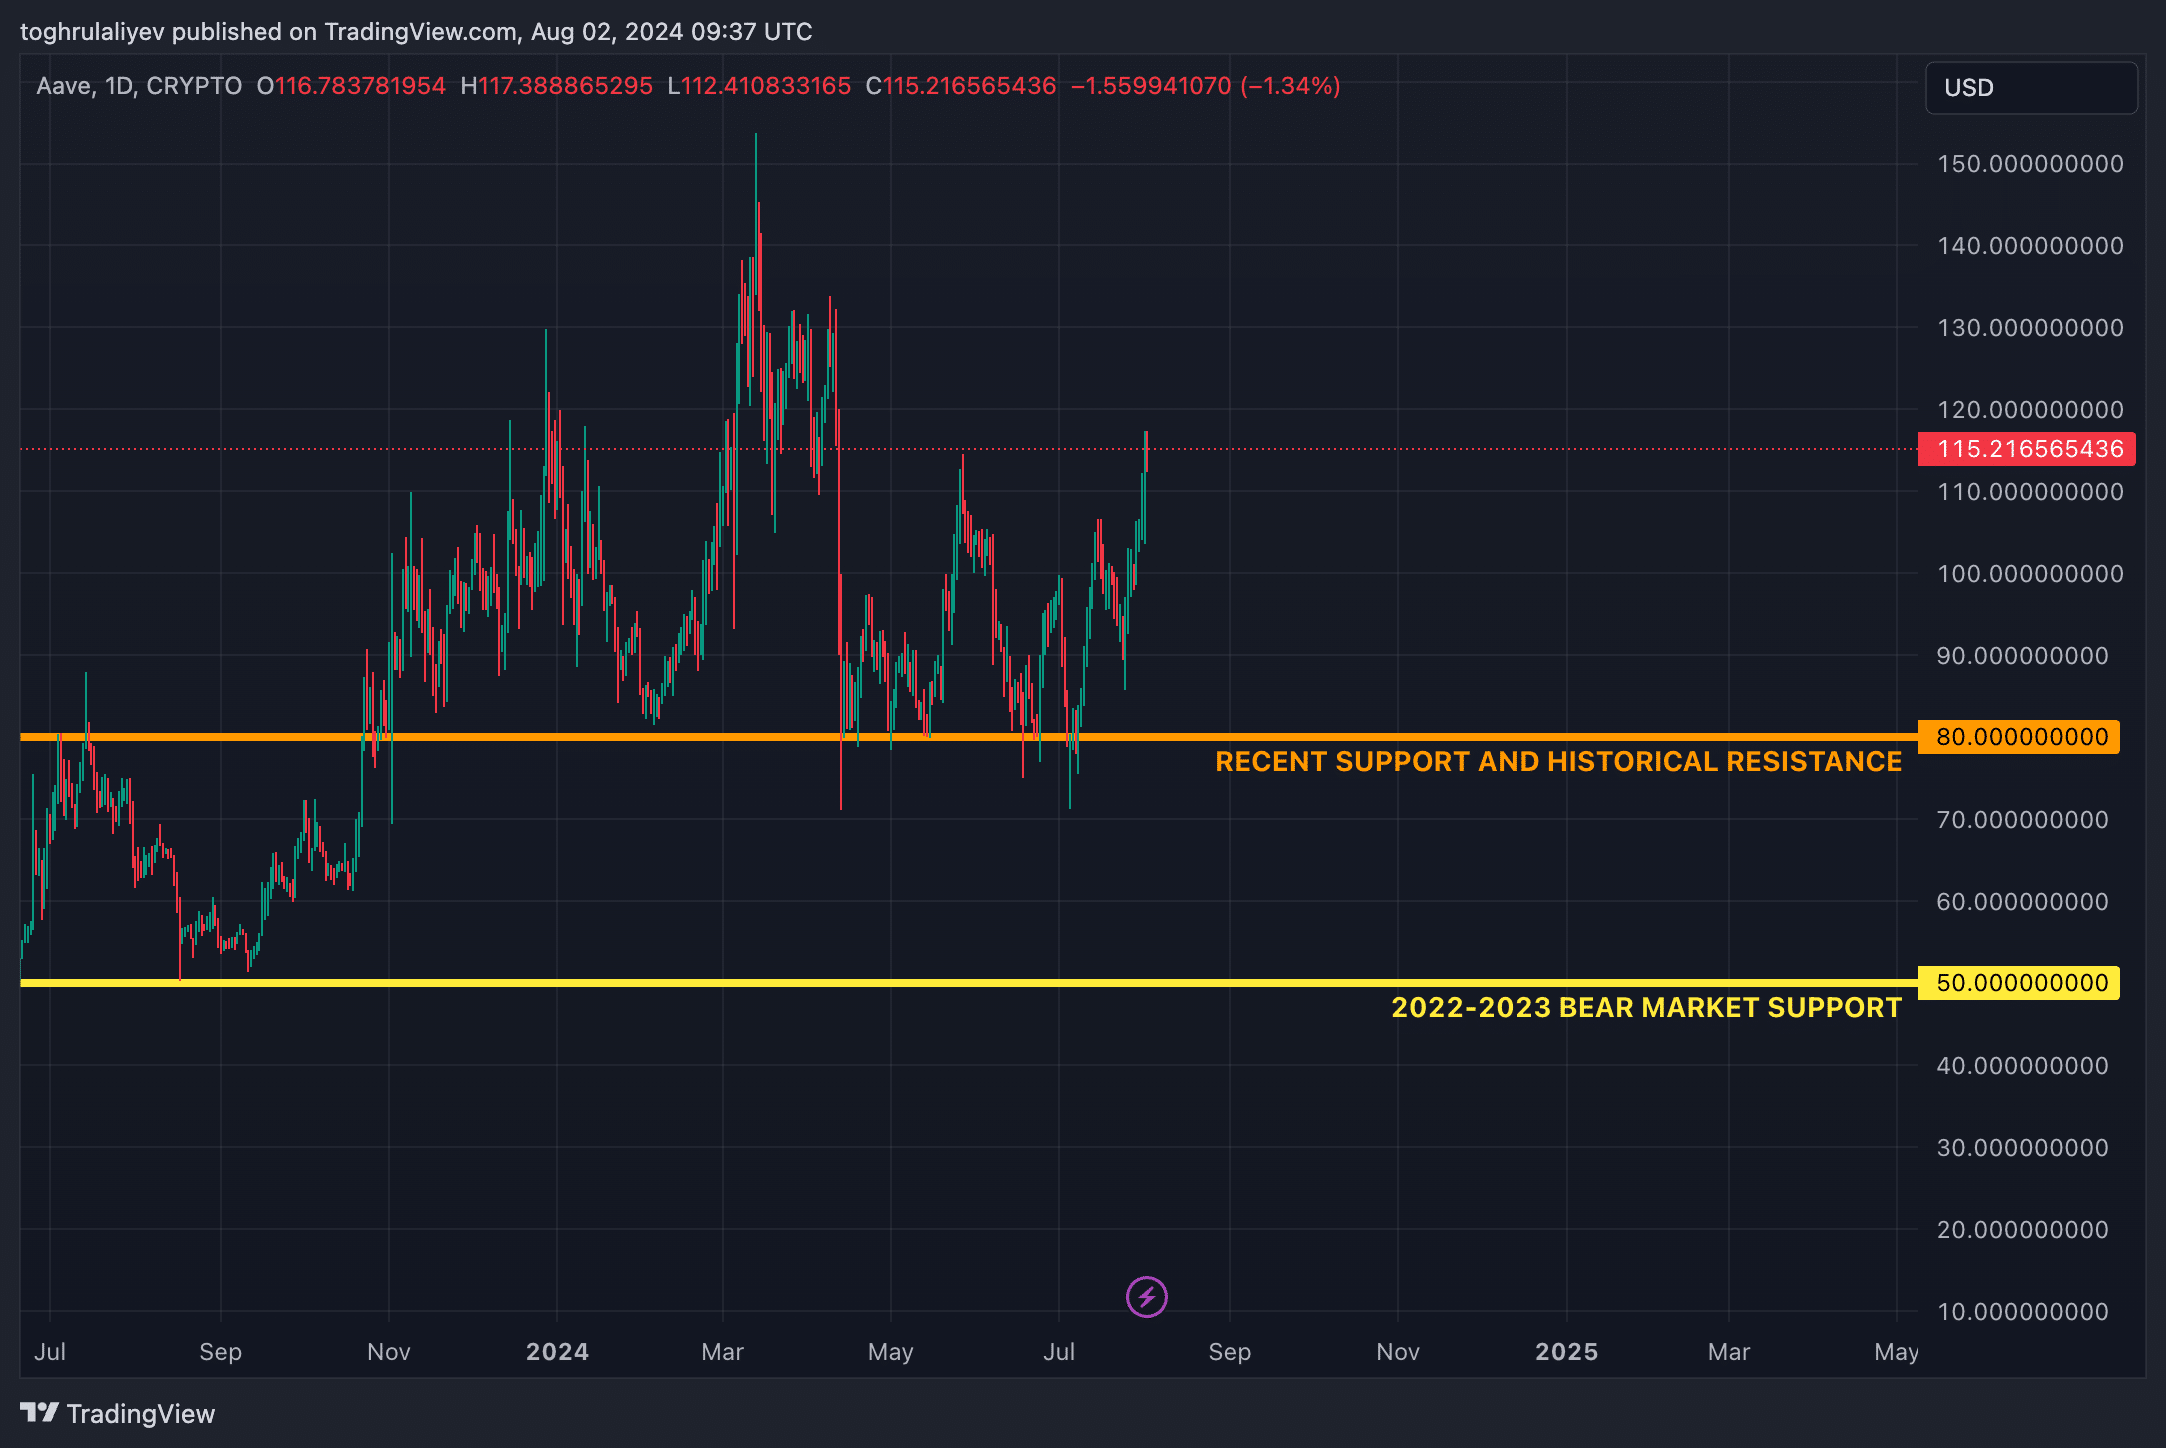
In looking at past price points where Aave has found support, two significant areas are noticeable: the $80 and $50 thresholds. However, considering the present market climate, it appears that Aave may not return to the $50 level. Conversely, the $80 mark is a more contemporary instance of support and warrants attention as we observe further price movements in Aave.
Fibonacci retracements analysis
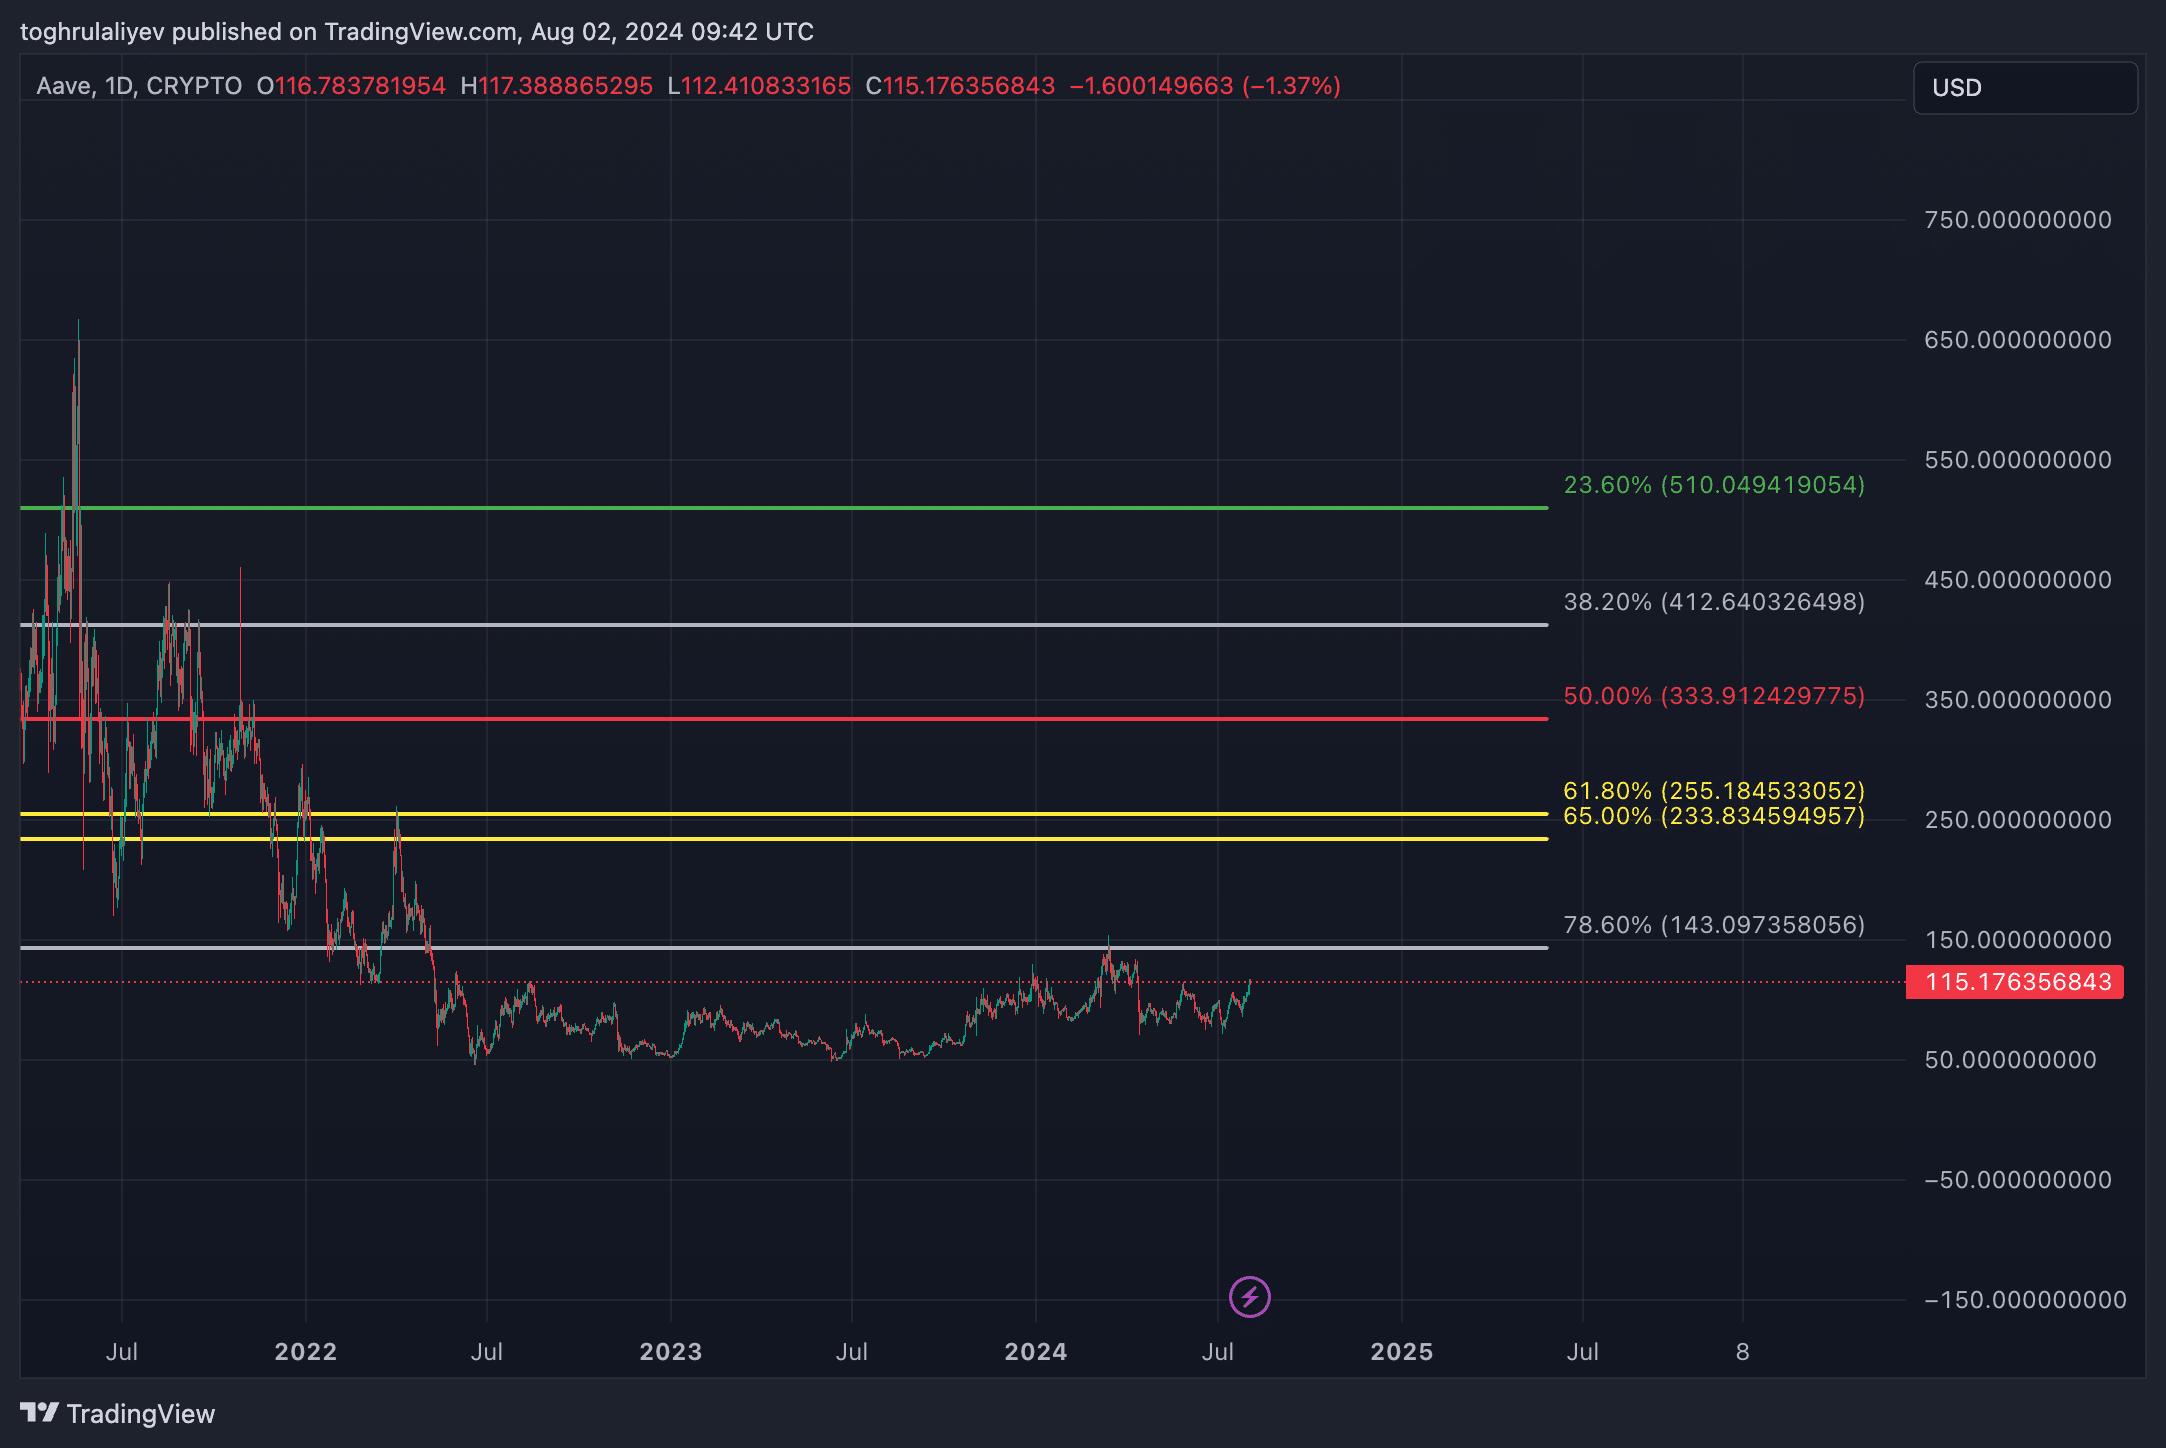
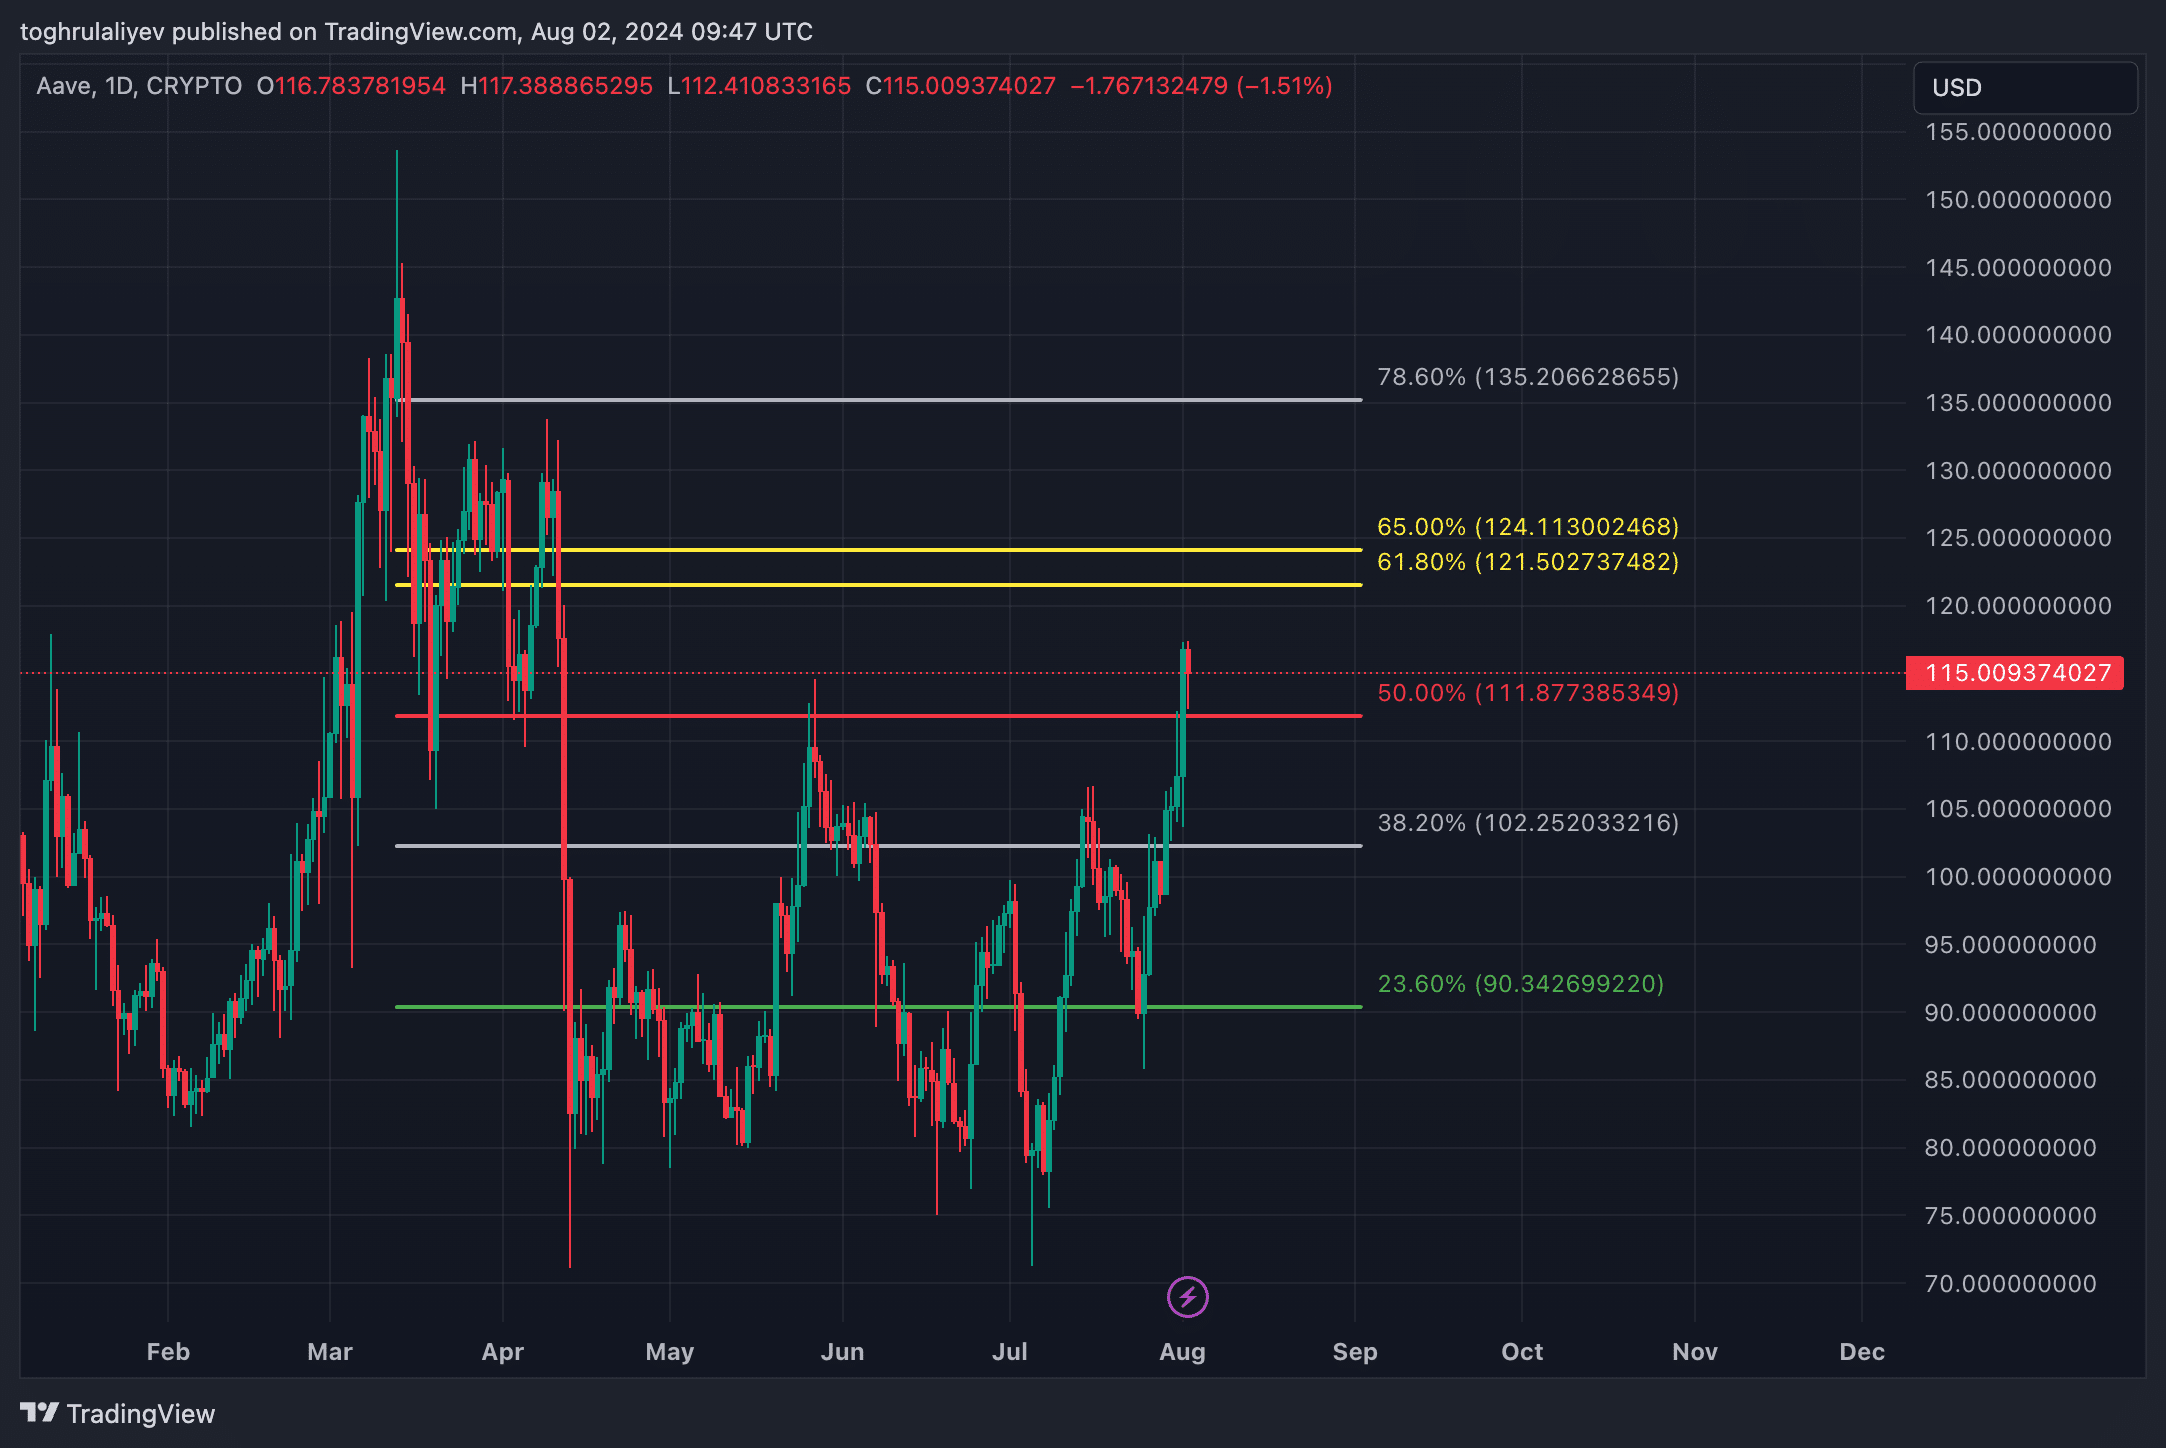
Examining the major Fibonacci retracement from the 2019 August low to the 2021 May high, we notice a substantial 78.6% retracement point at approximately $143.09. Previously, Aave last reached this level in March 2024, but it couldn’t manage to break beyond it. If Aave manages to overcome its historical resistance at $115, the next potential profit target would likely be set at the $143.09 level.
Moving forward, looking at the Fibonacci retracement levels from the March 2024 peak to the April 2024 trough, Aave has surpassed the 23.6%, 38.2%, and 50% markers. Currently, it’s heading towards the ‘golden pocket’, a region between $121.50 and $124.11. If Aave manages to overcome the $115 barrier, this golden pocket becomes an important area to focus on due to its potential for further growth. This zone is robust and relatively free of resistance, making it a probable destination for continued upward momentum.
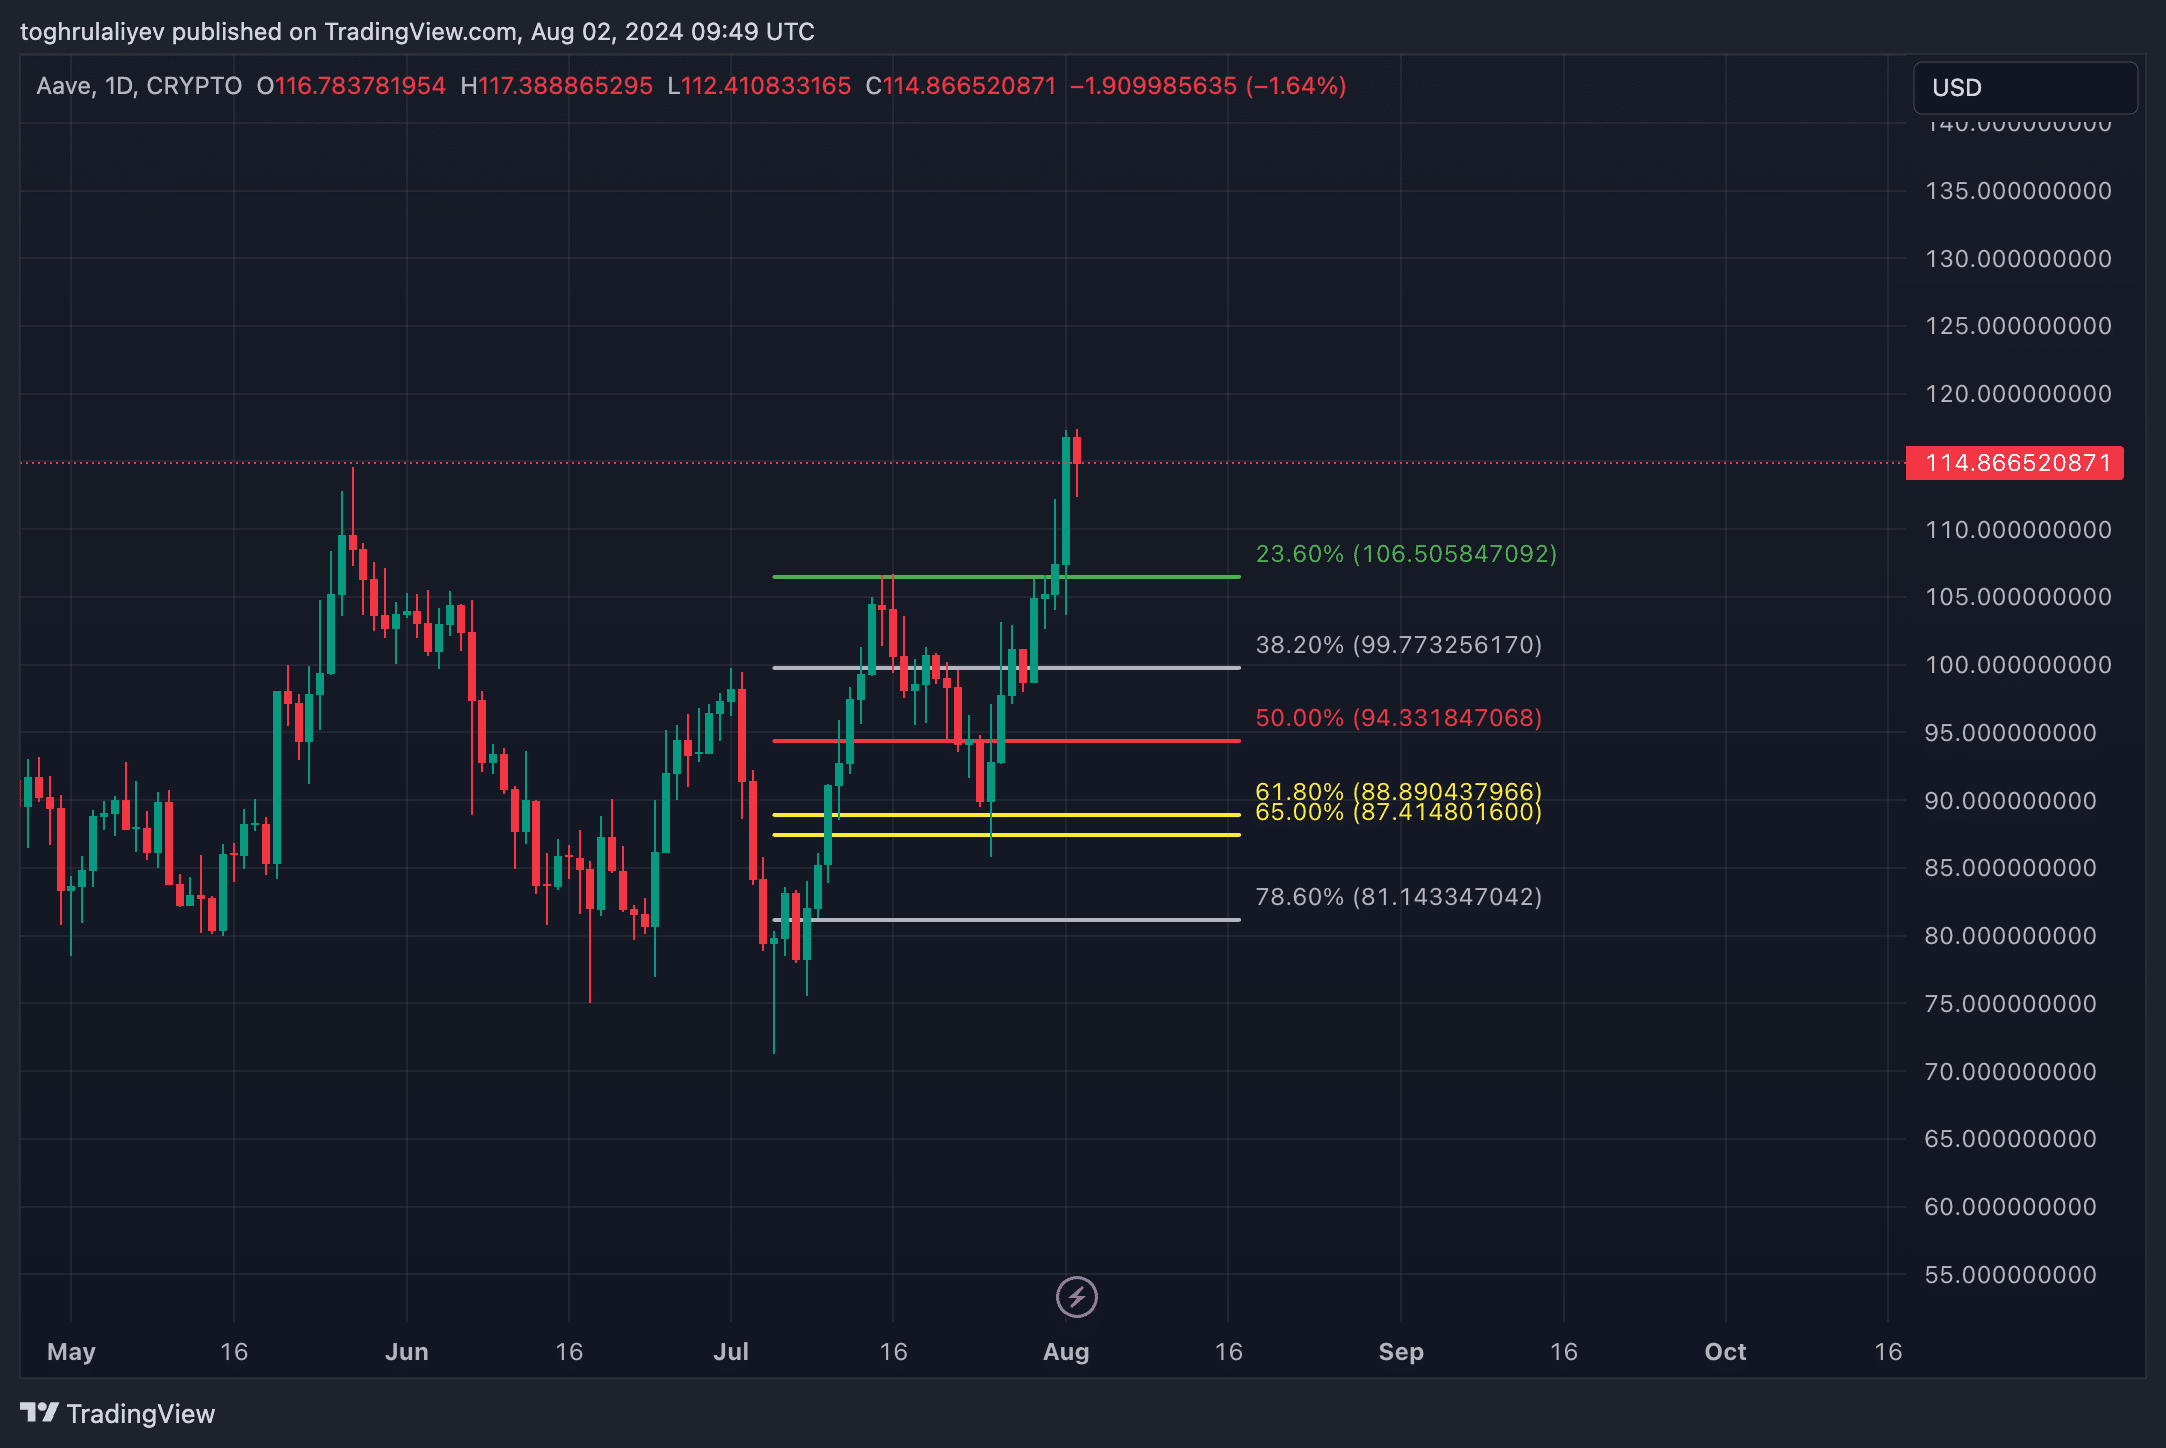
In summary, if Aave does not manage to surpass the $115 resistance, we predict two possible points where it might pull back. The first one is approximately $106.50, representing a 23.6% Fibonacci retracement from the early July low. The second potential point is around $99.77, which corresponds to the 38.2% Fibonacci level and aligns closely with the psychological $100 mark.
Technical indicators
Bollinger Bands
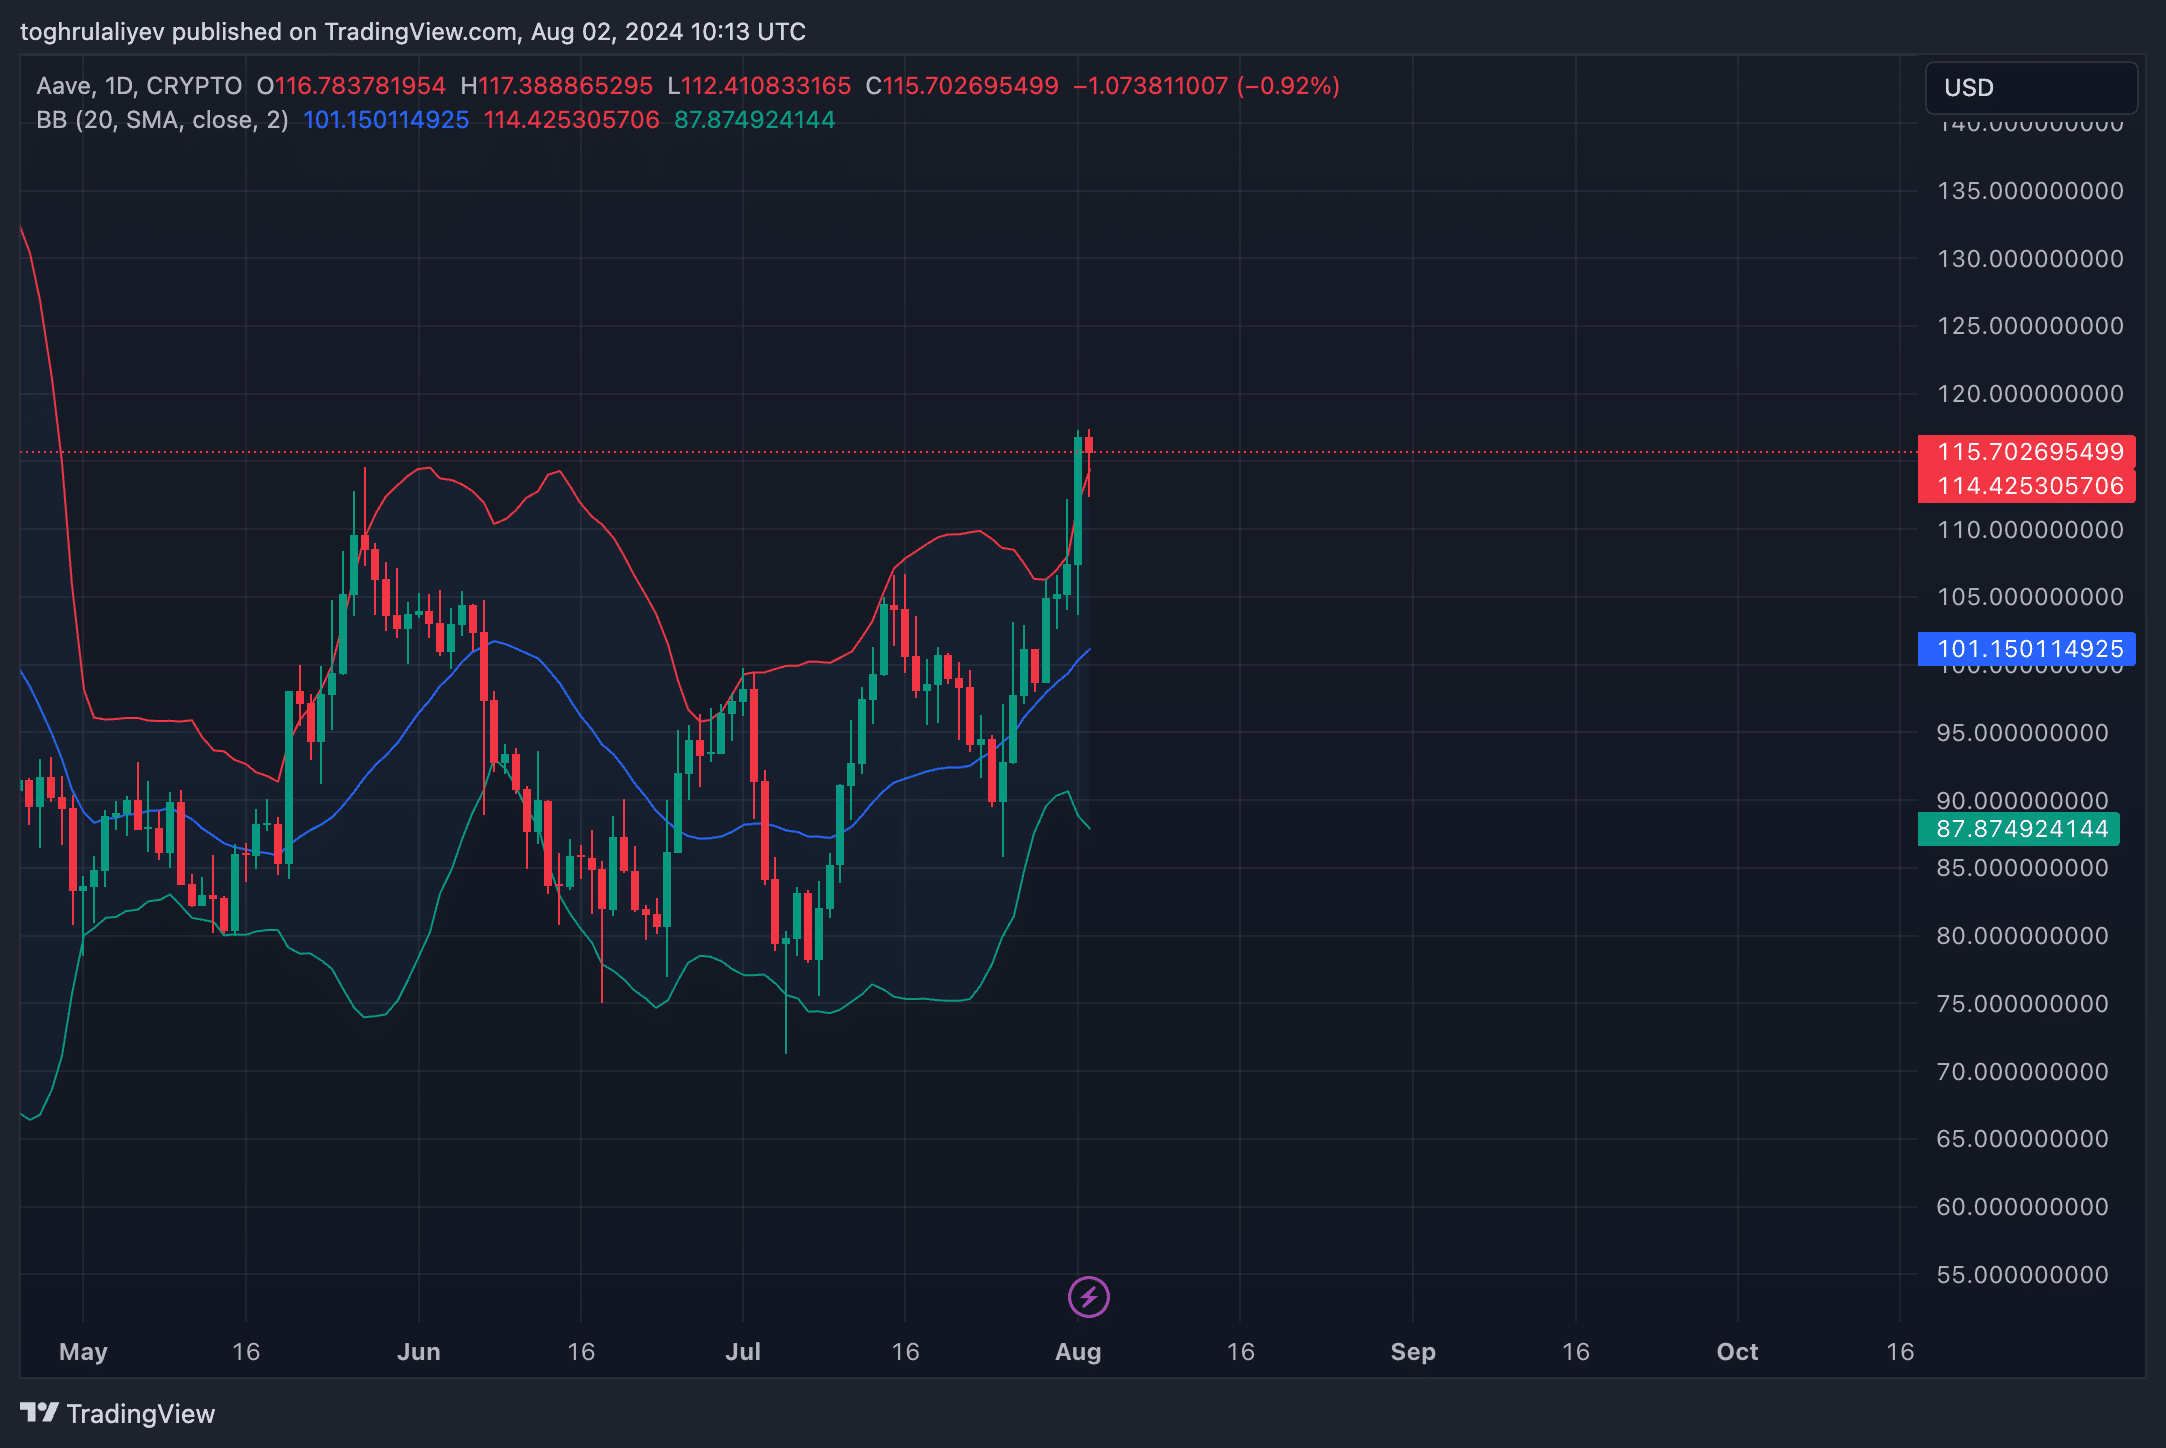
In simple terms, the cost of Aave has recently risen, pushing it over its upper Bollinger Band. This suggests that the current upward trend might be overextended. Normally, being above the middle band means a strong rising market, but being above the upper band usually indicates the asset is overbought. This means the upper band could be acting as a barrier for further price increases, making it unlikely for significant growth at this point. Therefore, there’s a possibility that Aave may undergo a correction soon, as its price returns to a more balanced level within the Bollinger Band range.
MACD
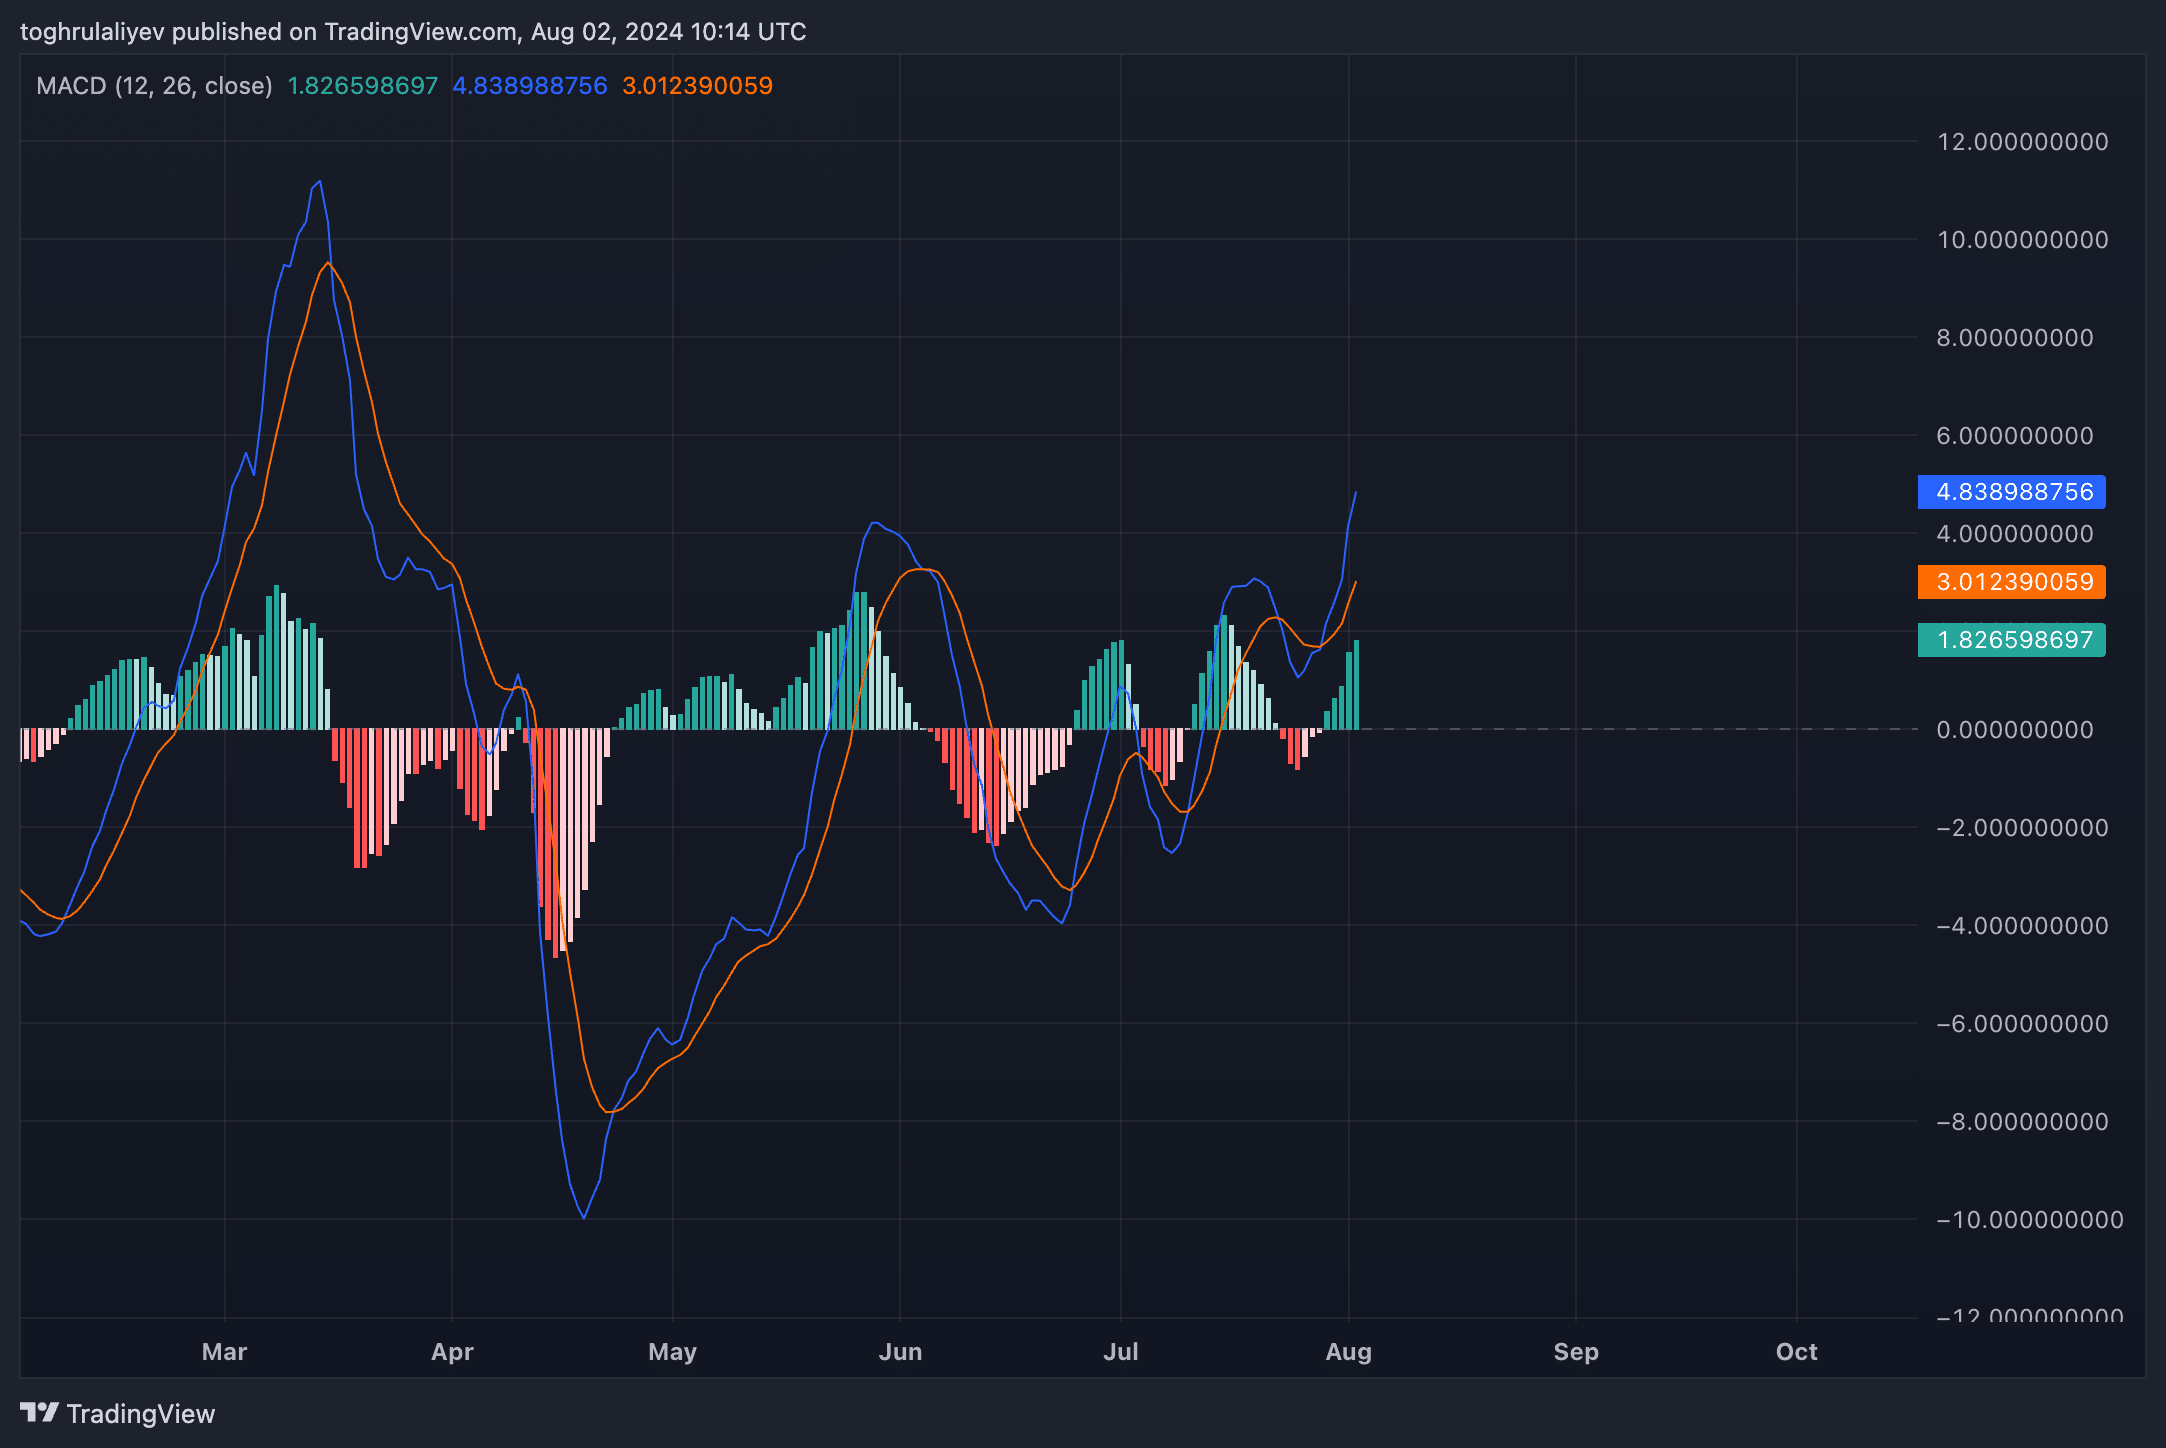
The Moving Average Convergence Divergence (MACD) chart is persistently climbing and stays within the green zone, suggesting a strong positive trend, or bullish sentiment. Additionally, a recent bullish event, where the MACD line surpasses the signal line, adds credence to the prediction of further price increases in the short term.
RSI
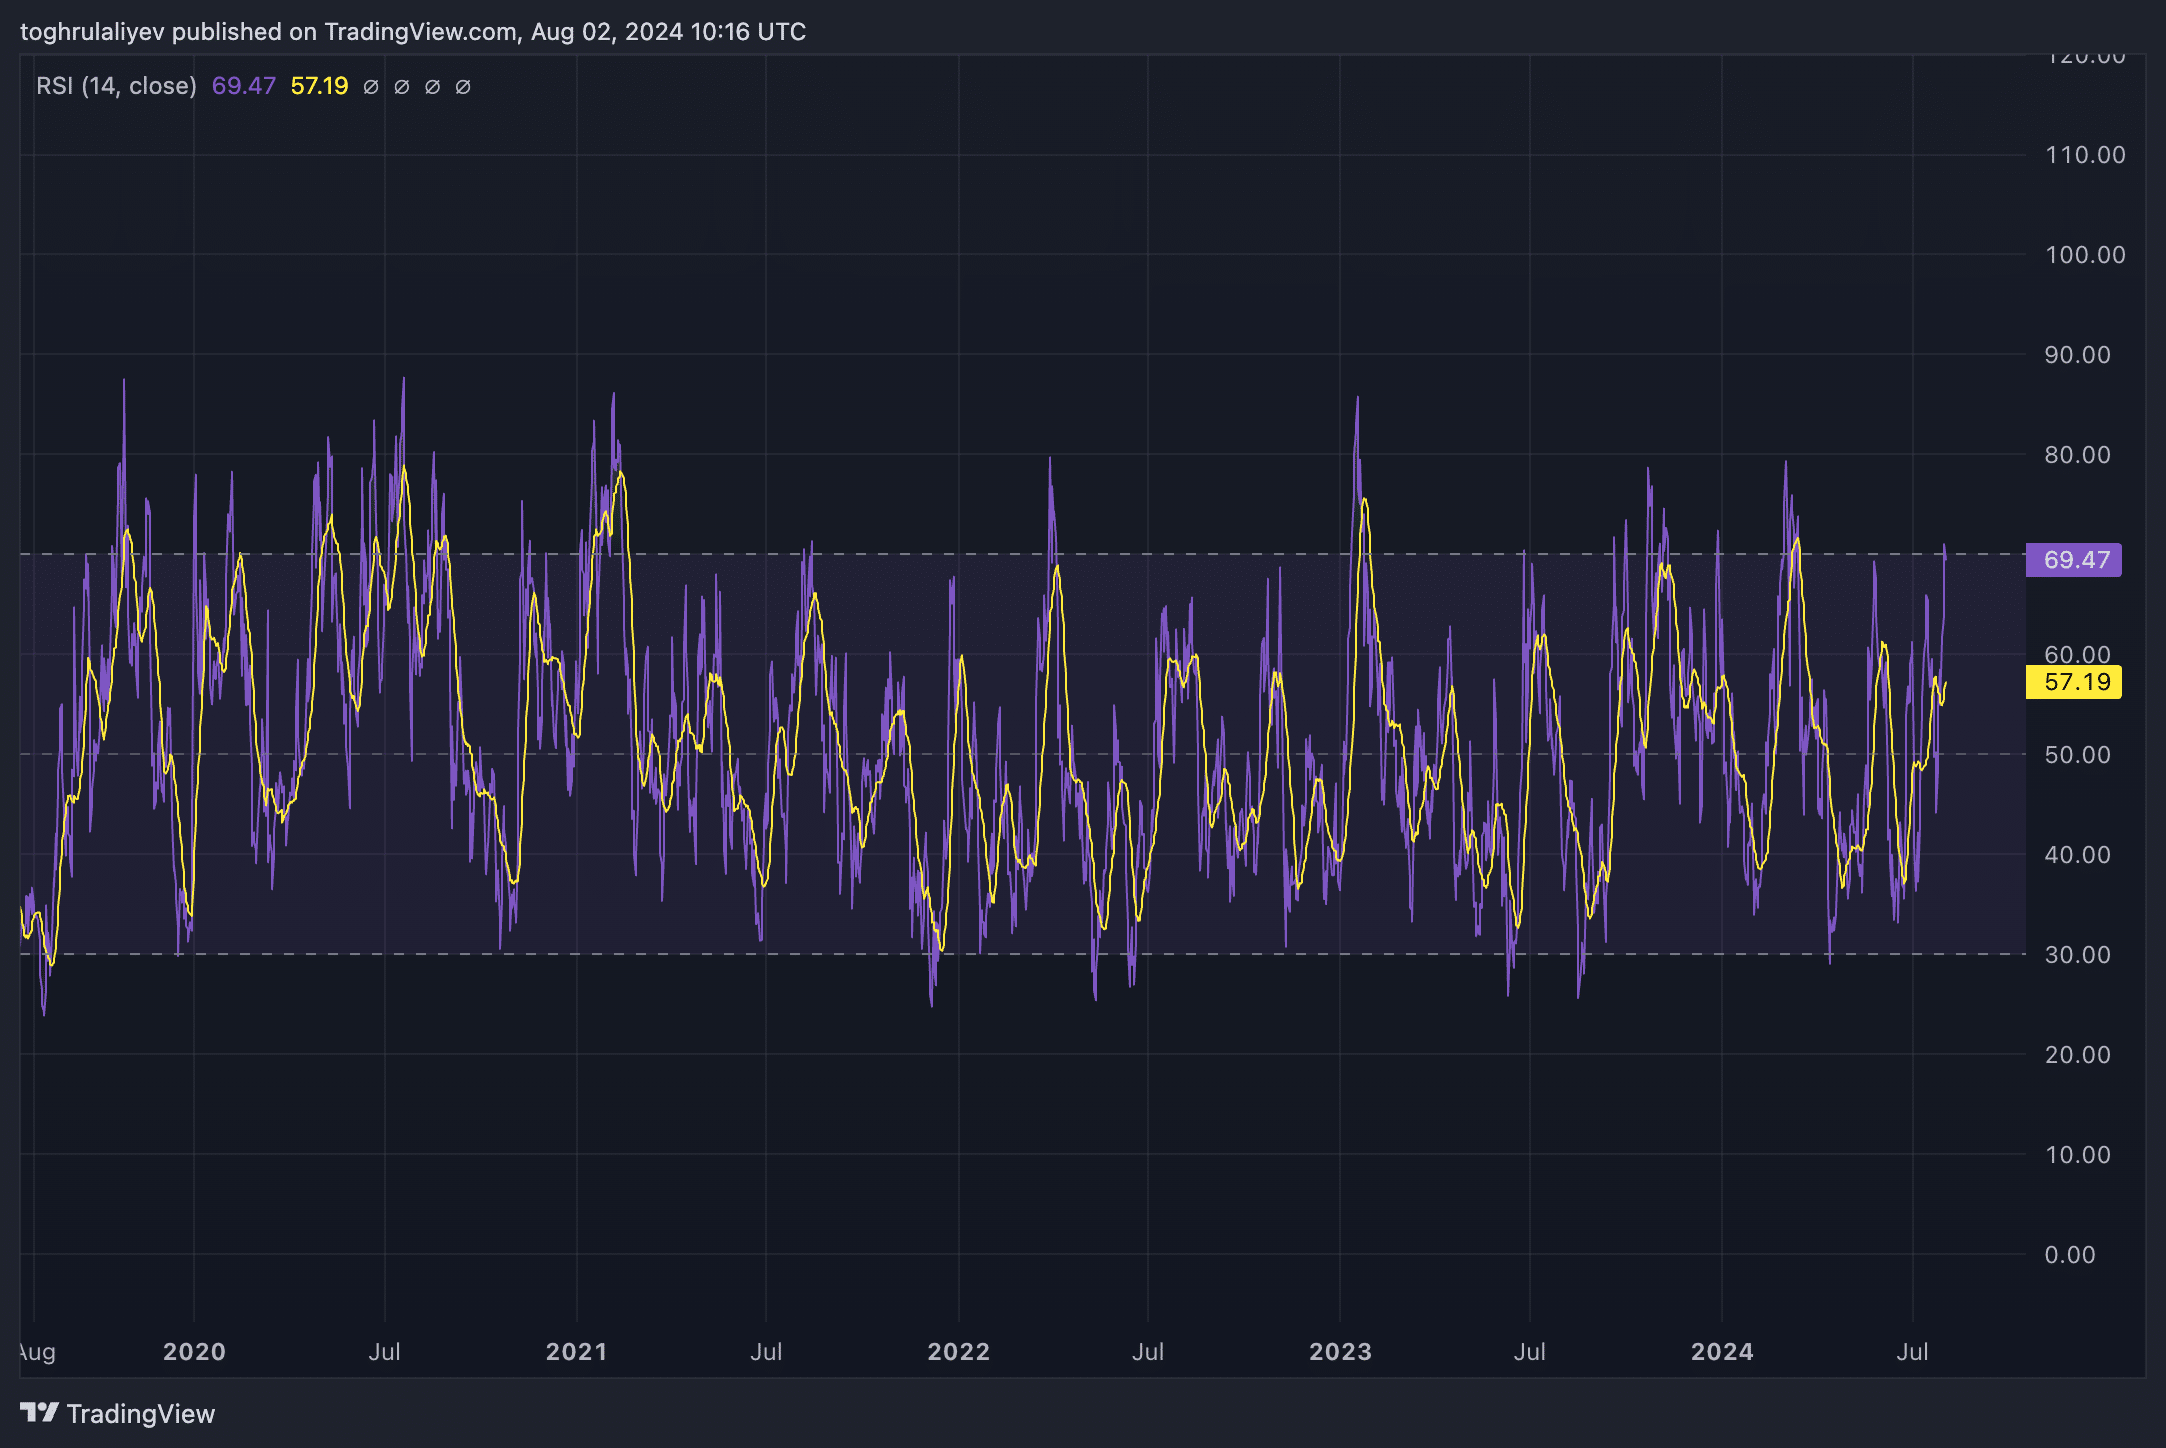
Conversely, the Relative Strength Index (RSI) for Aave is nearing the overbought zone, sitting close to the 70 mark. Typically, when Aave’s RSI reaches approximately 70, the bullish trend has frequently slowed down and resulted in a correction.
Strategic considerations
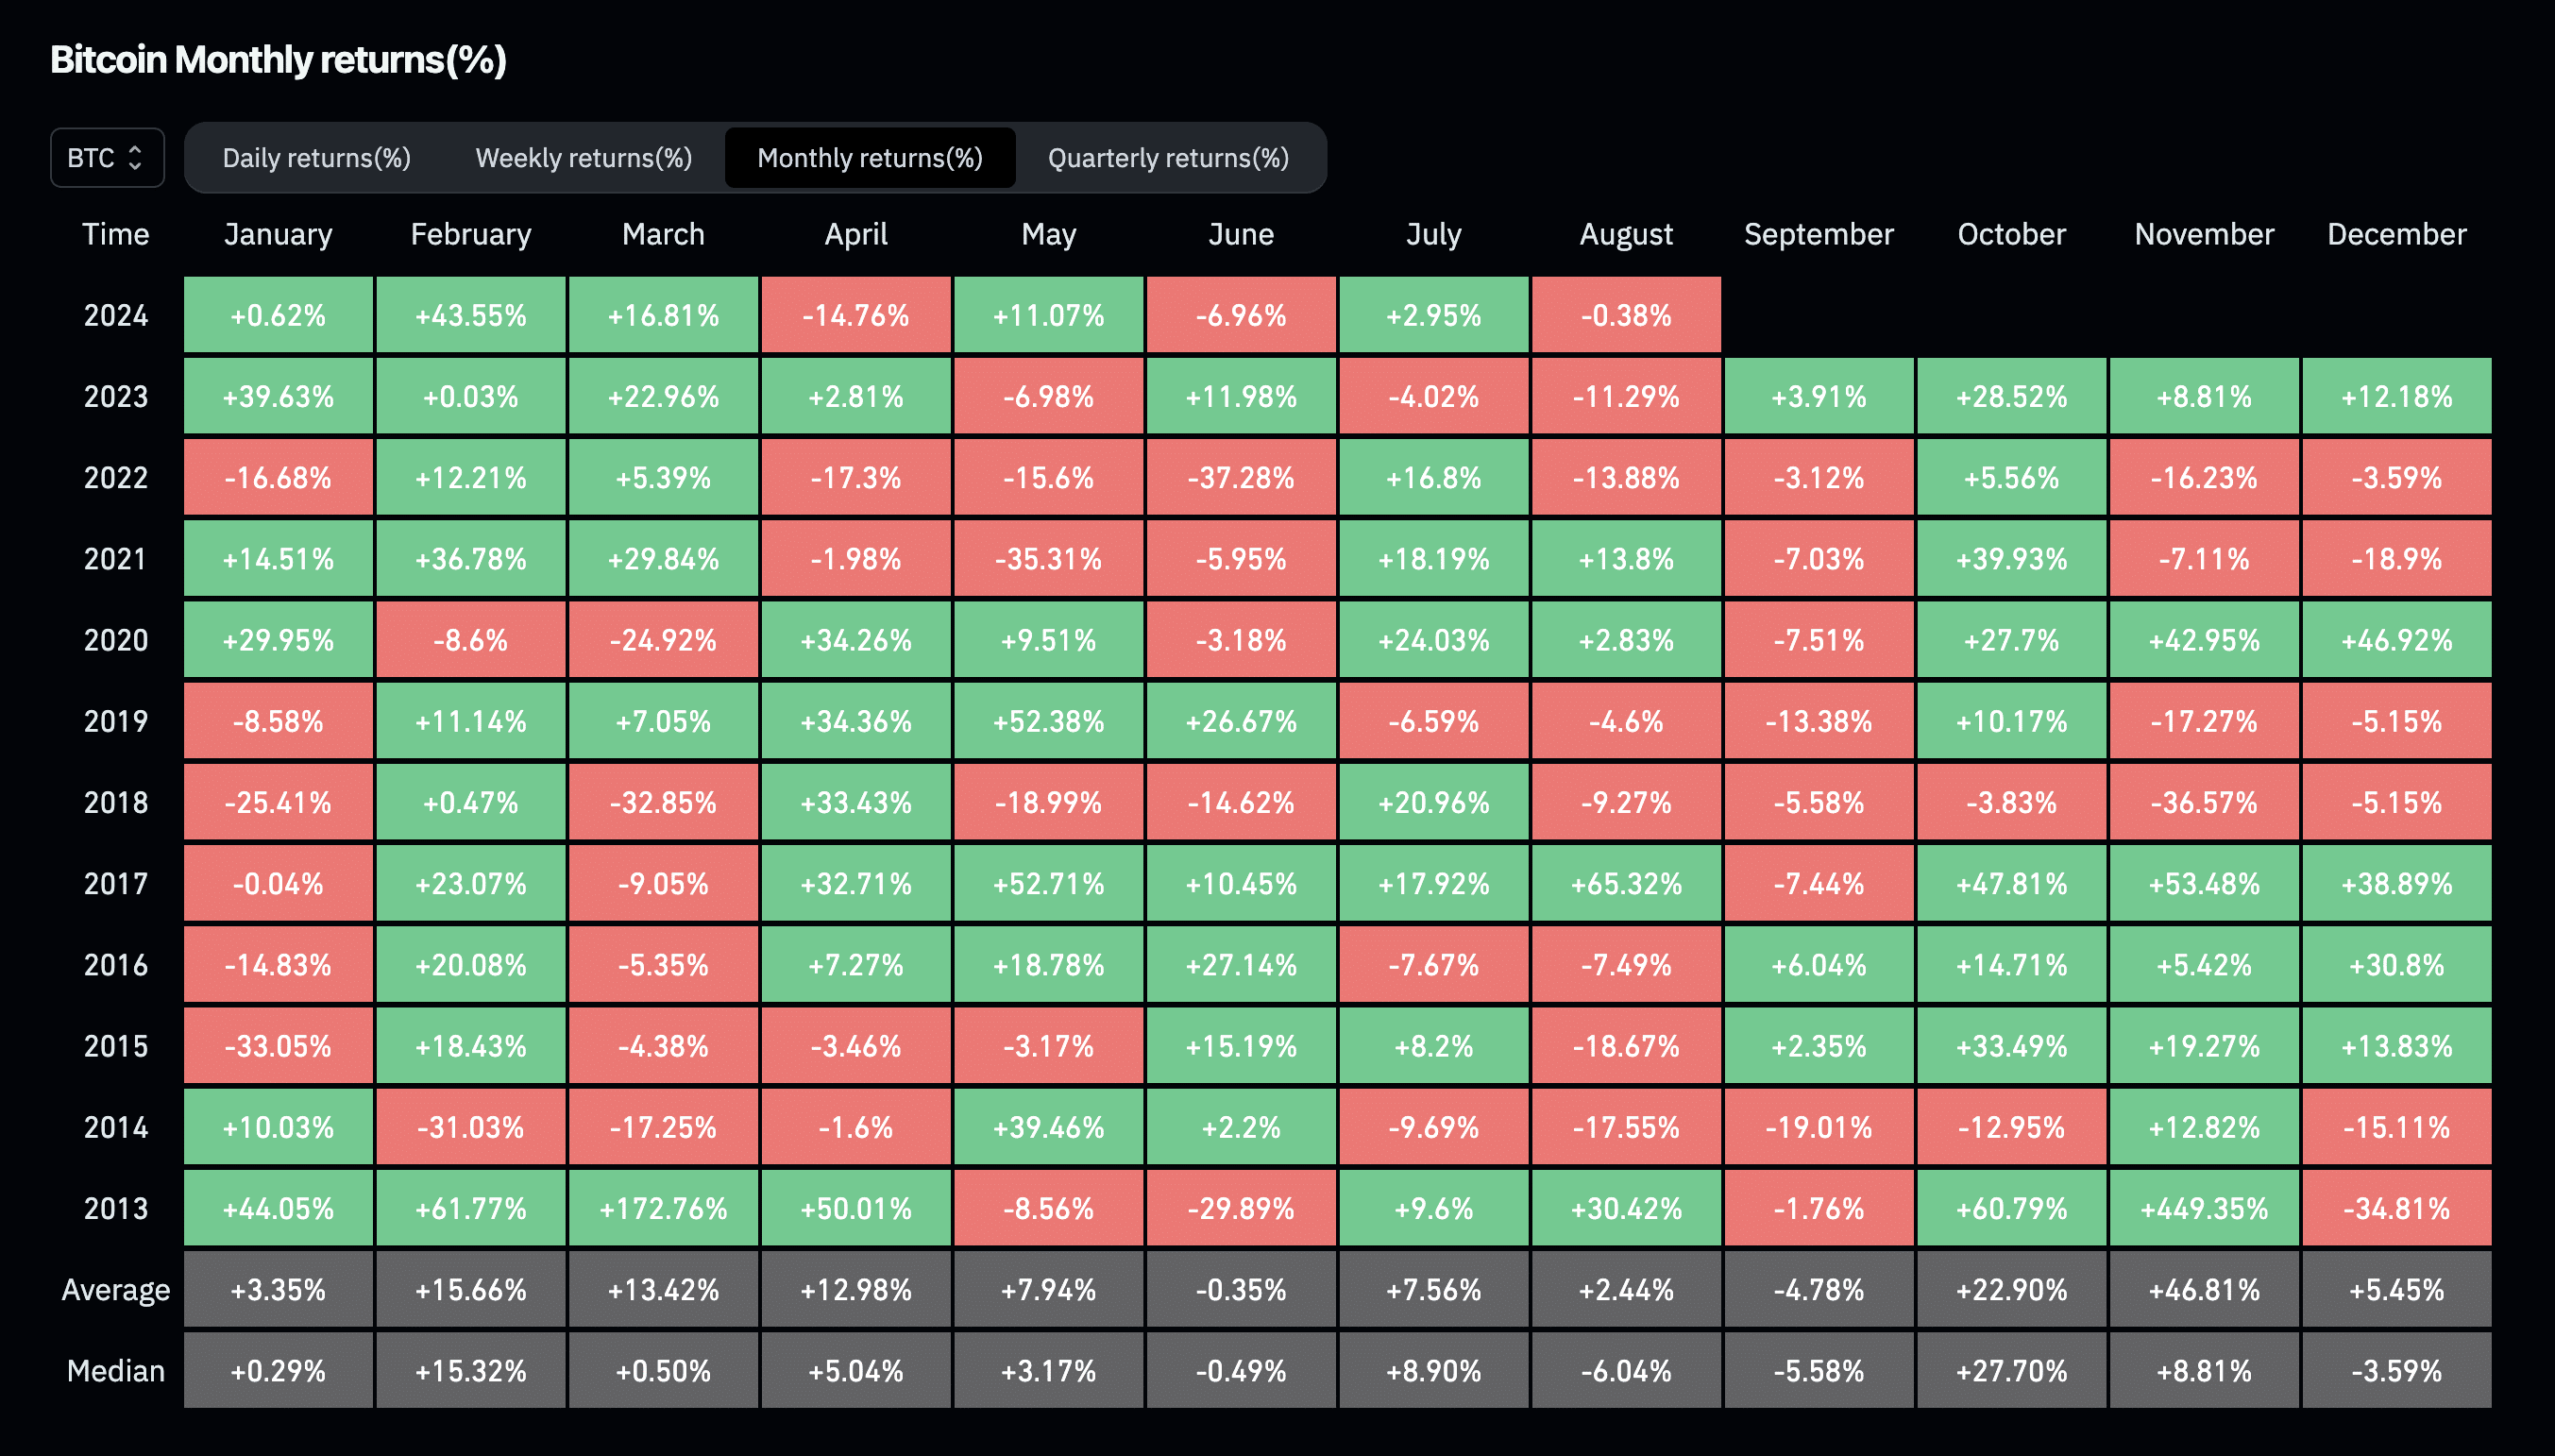
As a crypto investor, I can’t stress enough the importance of taking a close look at the seasonal trends within the digital currency market. Historically, August and September have proven to be tough months for cryptocurrencies. In fact, according to data from CoinGlass, these months often yield some of the least favorable median Bitcoin returns across the entire year. So, while it’s tempting to anticipate a substantial surge in Aave during this period, it might be overly optimistic given these historical trends.
In considering Aave’s current standing using the technical indicators mentioned, it becomes clear that while there may be signs of bullish activity, this momentum could be weaker than it seems at first glance. Only two factors – the recent breaches in Fibonacci retracement levels and positive signals from the MACD – hint at possible growth. However, the majority of other indicators suggest a potential correction is imminent.
Furthermore, although Aave has thrived due to favorable updates and heightened whale involvement, it appears that this momentum is starting to wane.
Increased amounts of Aave are moving towards exchanges, suggesting possible selling activity might be on the rise. For example, on August 1 alone, the exchange inflow surpassed $8 million.
![]()
Considering these factors, several price targets emerge if Aave (AAVE) fails to break above $115:
- First target: $106.50
- Second target: $100
- Third target: $95
- Fourth target (worst-case scenario): The golden pocket is between $87.41 and $88.89, which closely aligns with the $90 level.
Should Aave surpass $115, the perspective is likely to become more optimistic. In this situation, traders need to keep an eye on a potential retest of the $115 mark as a new support level. If Aave successfully maintains this level, it would signal a successful breakout and strengthen the positive trend. At that point, profit objectives should be revised upward, with a focus on the golden range between $121.50 and $124.11, followed by $135.20 and eventually $143.09.
Read More
- Grimguard Tactics tier list – Ranking the main classes
- Silver Rate Forecast
- USD CNY PREDICTION
- 10 Most Anticipated Anime of 2025
- Black Myth: Wukong minimum & recommended system requirements for PC
- Box Office: ‘Jurassic World Rebirth’ Stomping to $127M U.S. Bow, North of $250M Million Globally
- Former SNL Star Reveals Surprising Comeback After 24 Years
- Gold Rate Forecast
- Hero Tale best builds – One for melee, one for ranged characters
- Mech Vs Aliens codes – Currently active promos (June 2025)
2024-08-03 01:37