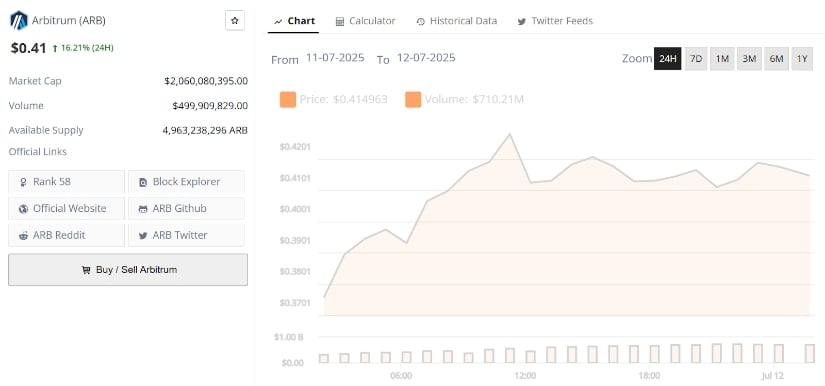
Arbitrum has just broken out of its falling channel, flipping key resistance into support and sparking fresh bullish momentum. With price closing above $0.41 and volume surging nearly 90%, ARB is starting to turn its eyes toward higher targets.
Arbitrum Breaks Downtrend, Eyes $1+ Target
After sliding for months in a falling channel, Arbitrum has just posted its first breakout. The daily chart shared by CryptoDoc shows a clean break above the upper boundary of the channel, signaling a shift in momentum. ARB held the buy zone between $0.35 to $0.30 levels. Price has now closed above key resistance around $0.42, flipping it into support.
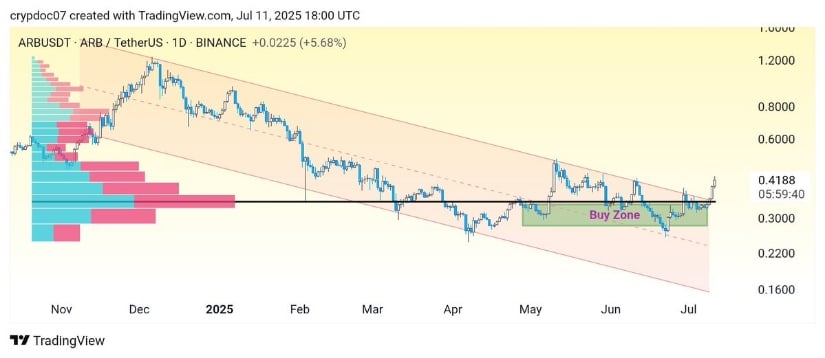
From a structure standpoint, the breakout is supported by a clean retest of prior resistance levels. If ARB can hold above $0.40 ot $0.42 going forward, the next logical resistance lies near $0.58, followed by $0.75 and then the psychological $1 level.
Arbitrum Forming a Bullish Wedge After Breakout
Following the macro breakout, Arbitrum (ARB) is now coiling up for its next lower-time frame move. A new 15-minute chart shared by GA Trading shows a classic bullish wedge forming right after the initial spike, often a continuation pattern when volume and momentum align. Notably, trading volume is up nearly 90%, showing that interest hasn’t dropped off after the breakout.
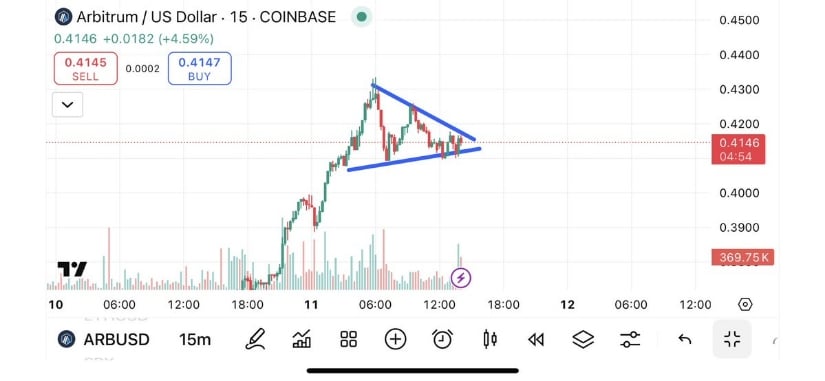
As long as ARB holds above $0.41, this wedge could break to the upside with $0.45 as the immediate target. If momentum kicks in, $0.48 to $0.50 becomes a realistic short-term zone to watch. Structurally, the key now is for price to maintain higher lows and use the $0.41 to $0.42 area as a launchpad. While this is still early in the larger move, the intraday setup suggests bulls are keeping pressure on.
ARB Leads the Chain Inflows With $223M Surge
Fresh capital continues to pour into Arbitrum, and the numbers speak for themselves. According to the latest data, ARB dominated the last 24 hours in net inflows, attracting a staggering $223.57 million, far outpacing every other chain.
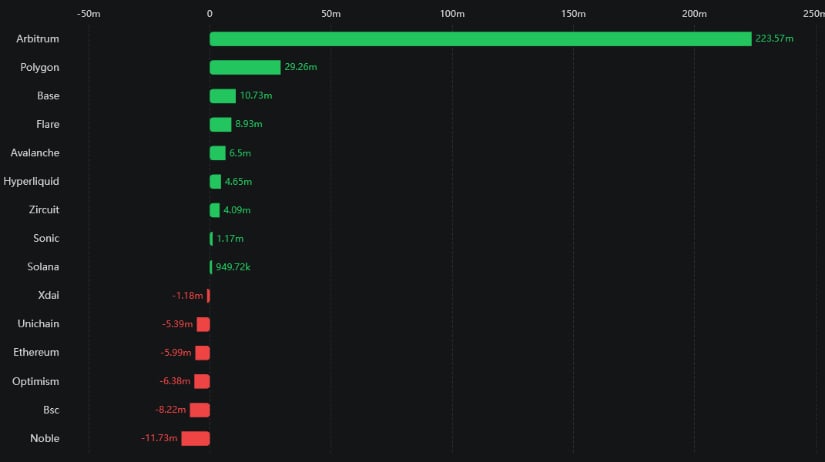
This level of inflow confirms the narrative that ARB’s breakout wasn’t just a chart move; there’s real liquidity backing it. Inflows of this magnitude often serve as a confidence signal, reinforcing momentum both on price and fundamentals.
Arbitrum Price Prediction: $0.95 in Sight, $3.70 on the Horizon?
Adding fuel to the momentum, CryptoNix has outlined a broader wave structure that places ARB’s next key levels at $0.95 in the short term, with a medium-term target stretching to $3.70. The chart points to a double-bottom confirmation and a completed fourth wave, hinting that the fifth impulsive wave could be underway. The structure follows a classic Elliott Wave pattern, and the price has now cleared the 200-day EMA.
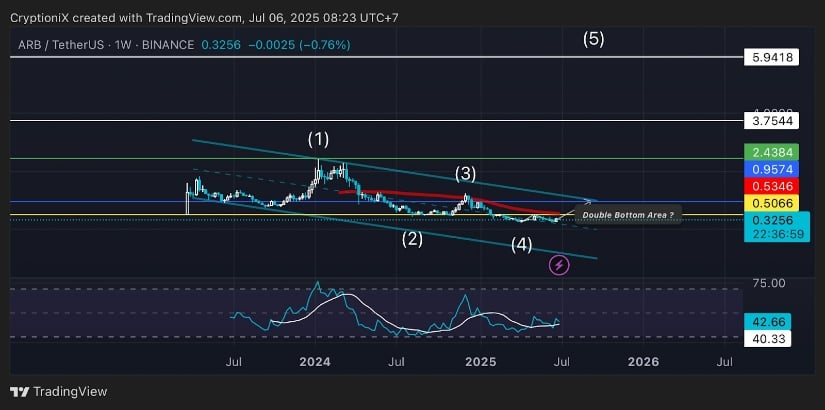
The chart also highlights $5.90 as a possible “euphoria” phase target, but that depends heavily on macro sentiment and Bitcoin’s trajectory. For now, traders will be watching how ARB behaves as it pushes through resistance zones.
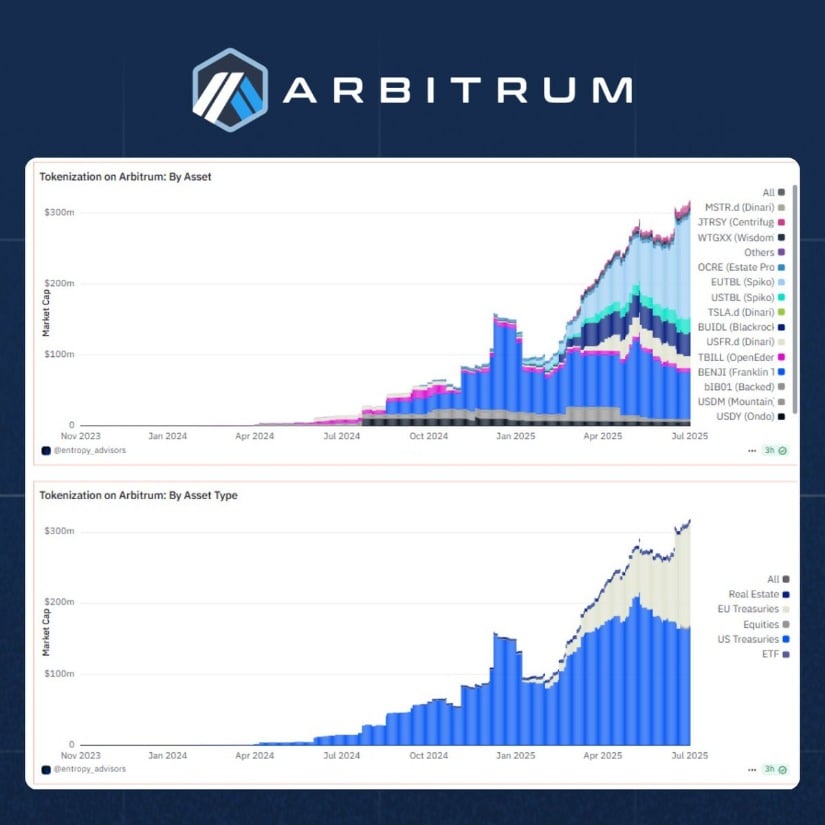
Arbitrum’s RWA Growth Strengthening Technical Outlook
Real-world assets (RWAs) are starting to get real momentum in crypto, and Arbitrum is picking up a strong share of that momentum. According to CryptoBusy, more than $275 million worth of RWAs are now live on the Arbitrum network, a new all-time high. This kind of growth adds solid backing to the recent price breakout and rising trading volume.
Final Thoughts
All signs point to Arbitrum heating up again, and this time, it looks different. The clean break above $0.42, rising volume, and bullish wedge formation all suggest this isn’t just a dead-cat bounce. Holding the $0.41 to $0.42 zone is now key, because if it does, the rally could accelerate toward $0.58 and $0.75 in the coming weeks. Add to that the $223M in inflows and surging RWA activity, and it’s clear that real money is stepping in. If momentum keeps building, a move towards $0.95 isn’t far off. 🚀📈
Read More
- Grimguard Tactics tier list – Ranking the main classes
- USD CNY PREDICTION
- 10 Most Anticipated Anime of 2025
- Silver Rate Forecast
- Box Office: ‘Jurassic World Rebirth’ Stomping to $127M U.S. Bow, North of $250M Million Globally
- Gold Rate Forecast
- Former SNL Star Reveals Surprising Comeback After 24 Years
- Black Myth: Wukong minimum & recommended system requirements for PC
- Mech Vs Aliens codes – Currently active promos (June 2025)
- “Golden” Moment: How ‘KPop Demon Hunters’ Created the Year’s Catchiest Soundtrack
2025-07-12 02:08