On April 18th, 2025, the value of Bitcoin hovered around $84,549, as traders considered its momentum and averaging techniques to determine the direction it might take.
Bitcoin
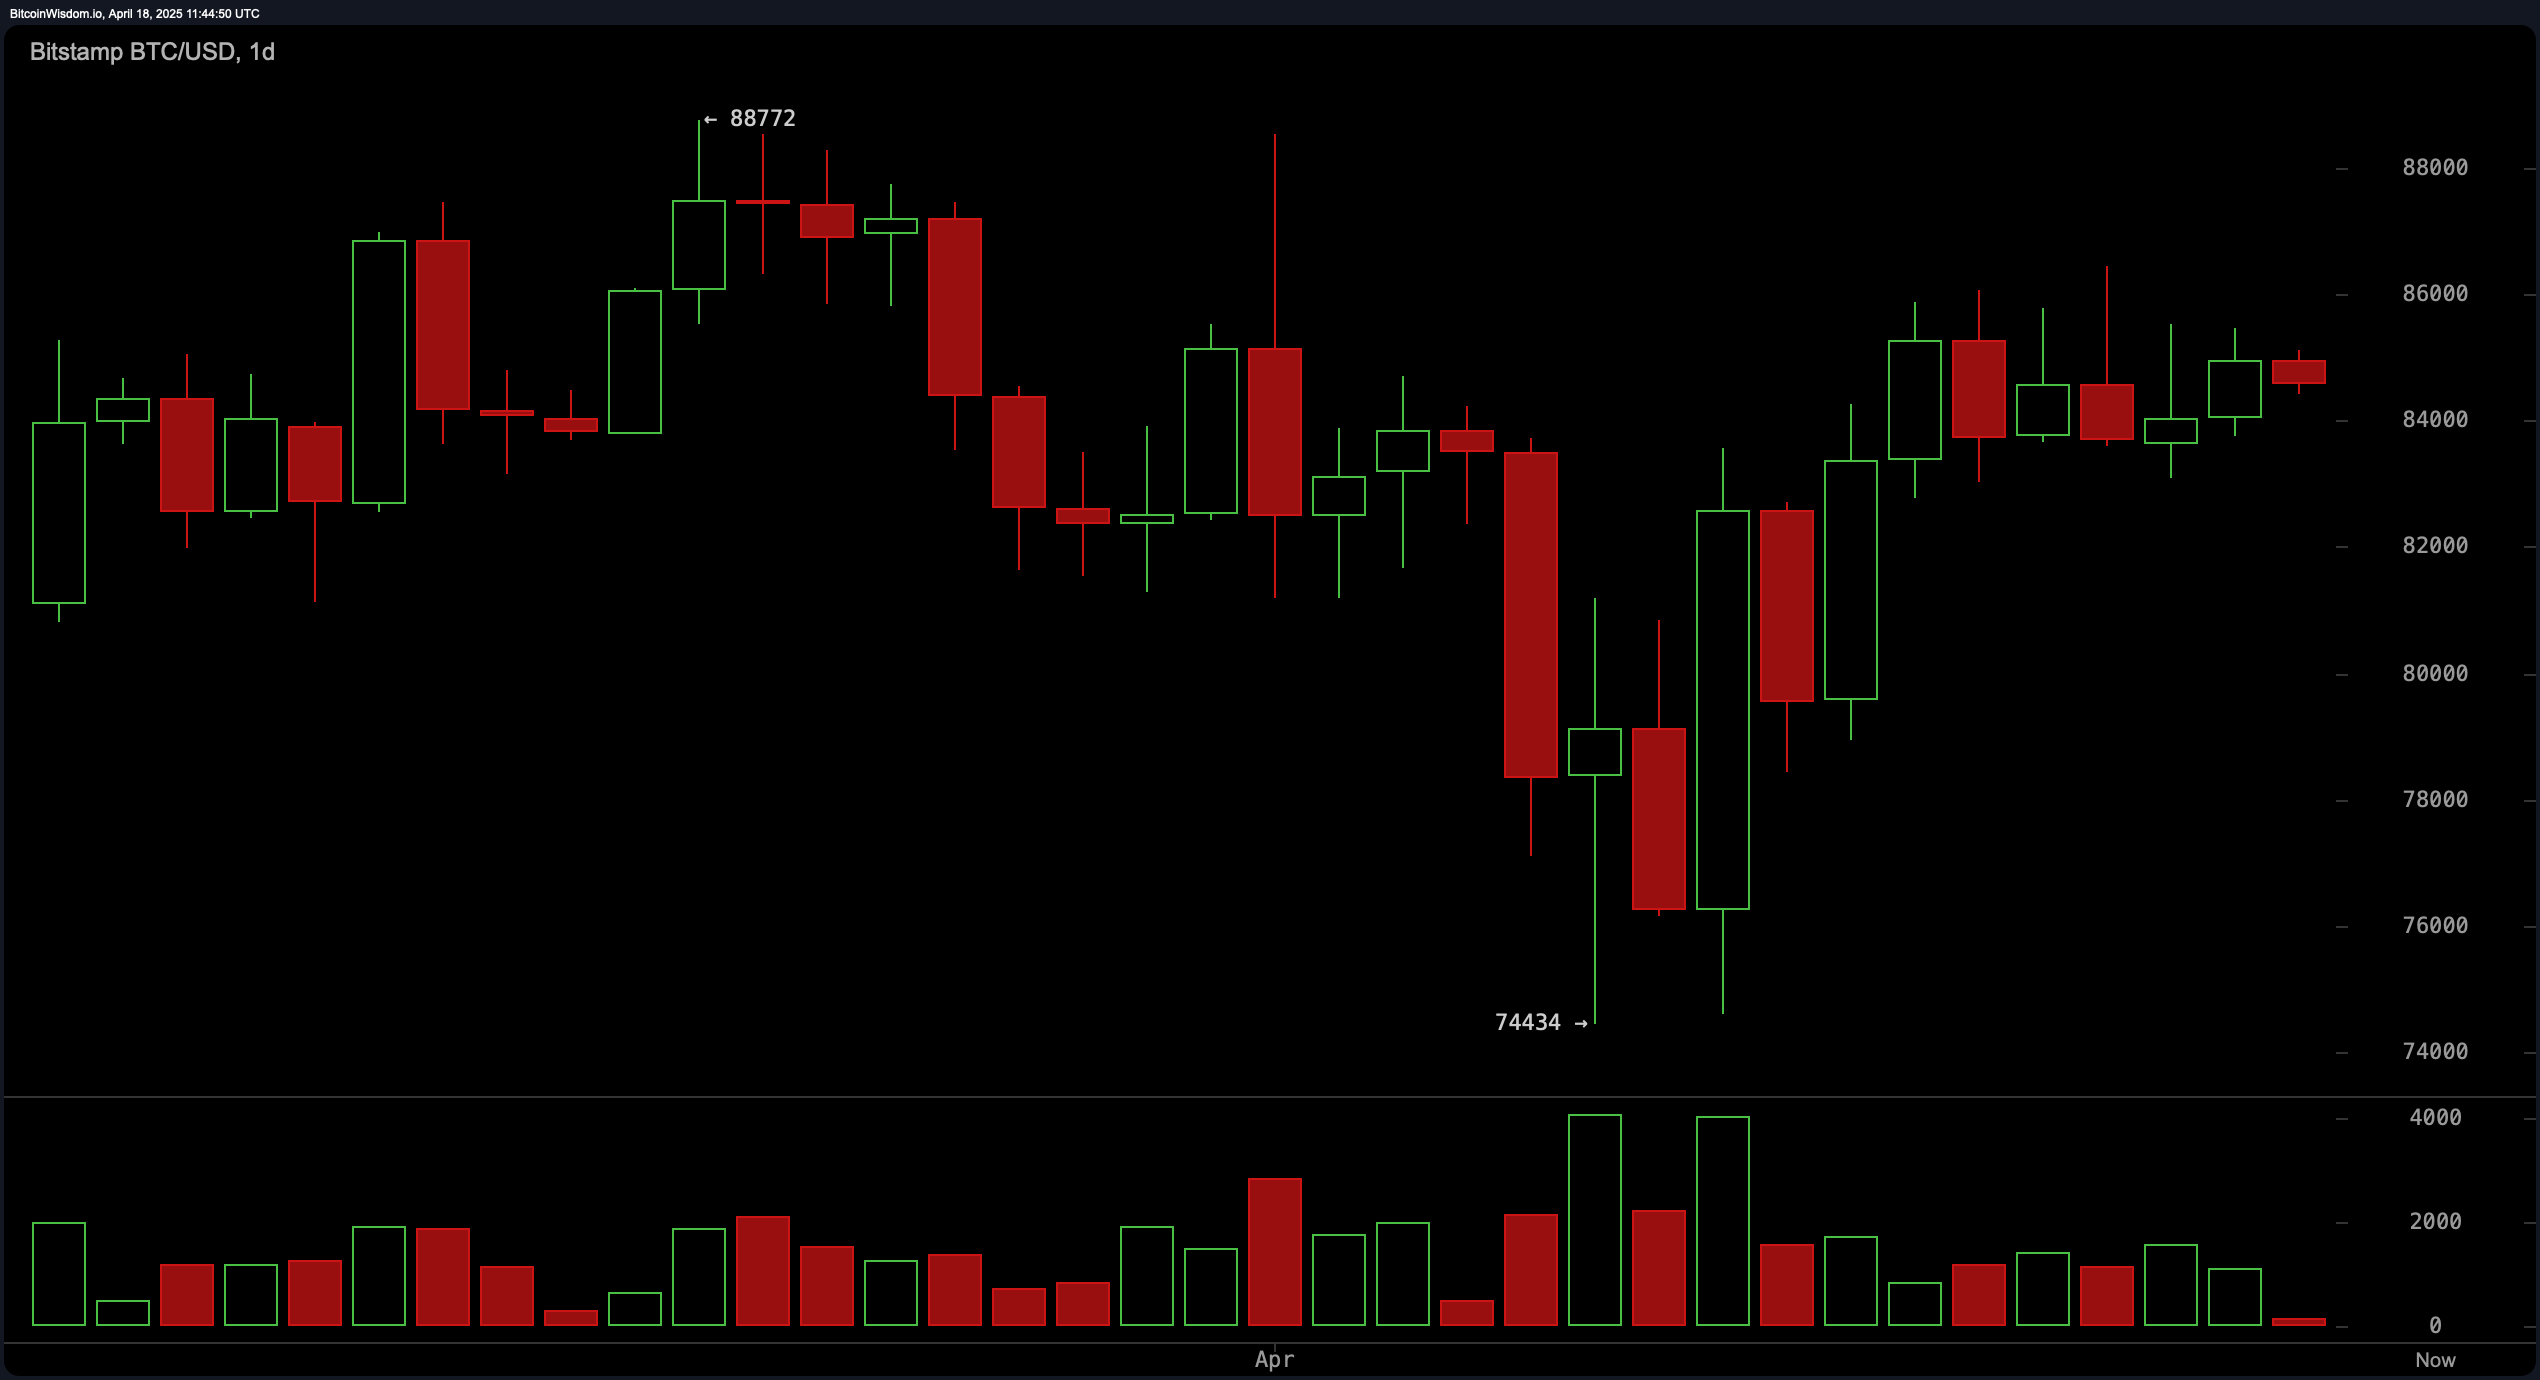
On the daily chart, bitcoin ( BTC) has traded in a defined range since forming a lower high near $88,772 and finding support around $74,434. The rebound from that level produced a V‑shaped recovery to the current price near $84,549, where sideways consolidation has taken hold. Key thresholds are $86,000 to the upside and $82,000 to the downside. A decisive close above $86,000 would signal renewed upward momentum, while a break below $82,000 could prompt a retest of mid‑$70,000s support.
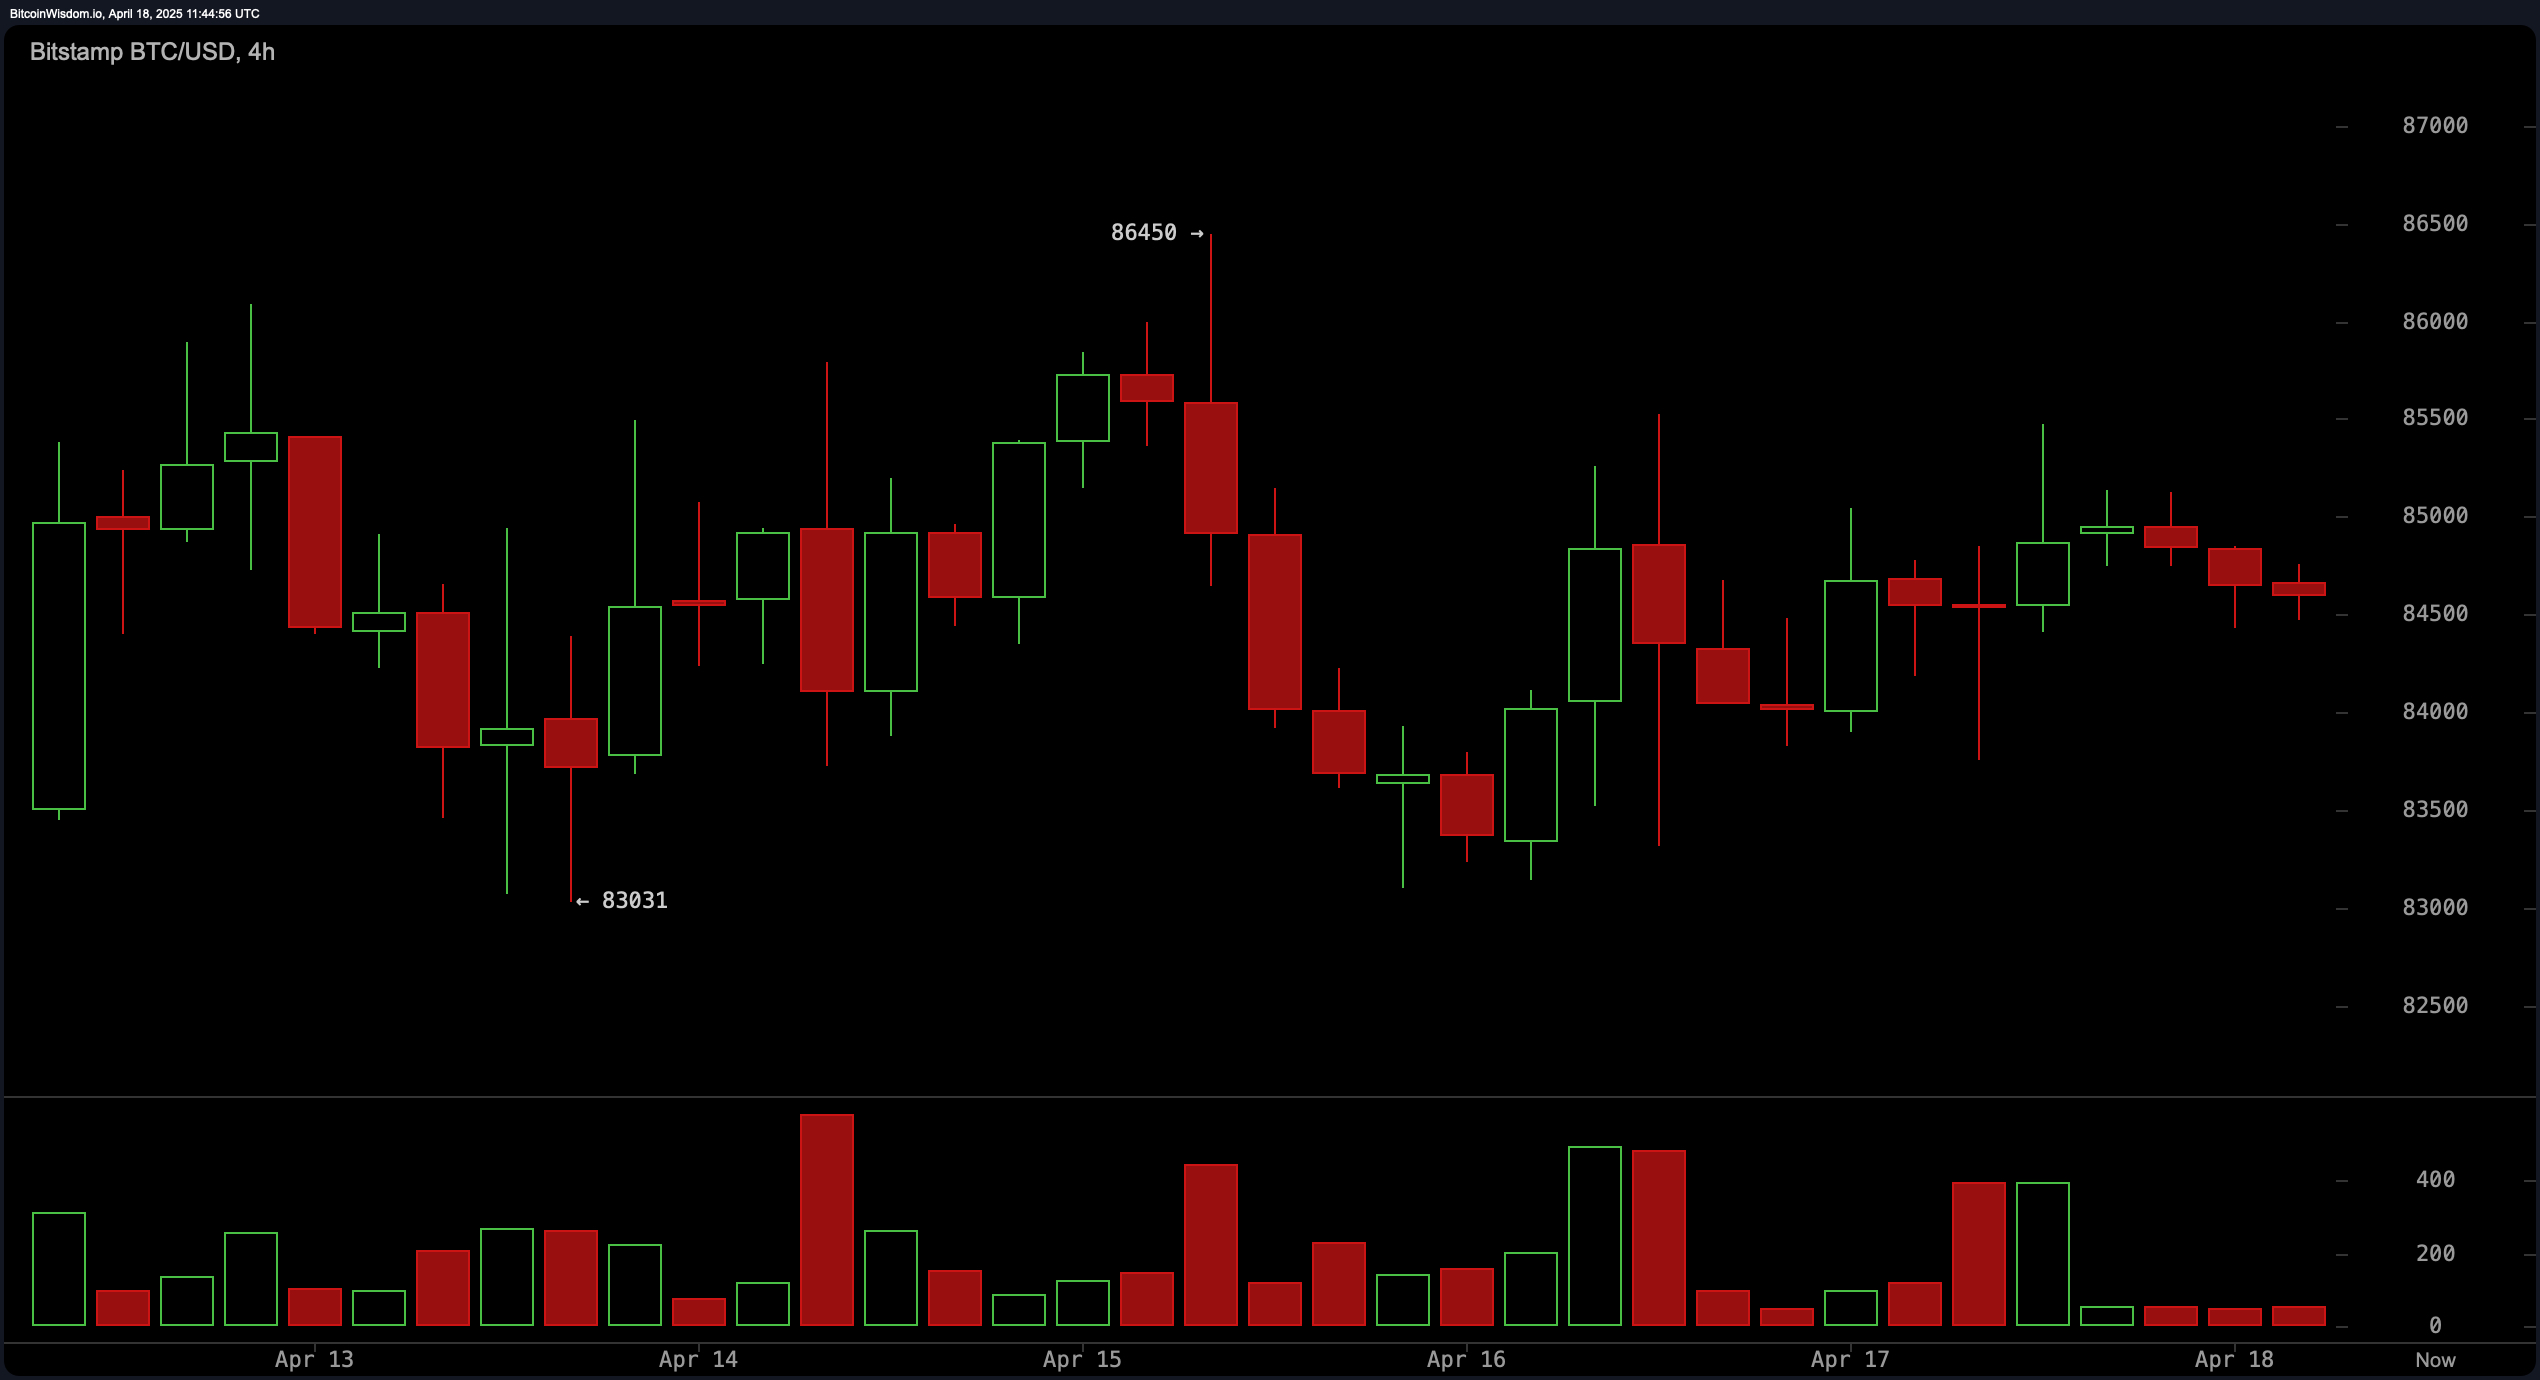
On the 4-hour price chart, we’re seeing a range bounded by $83,031 at the bottom and $86,450 at the top. This range is marked by ambiguous candlesticks and lower volatility. A strong move above $86,450 with increased trading volume would strengthen bullish expectations, while a sharp decline below $83,031 could boost bearish sentiments. Due to the possibility of significant price fluctuations, traders should consider using tight stop orders and adjust their position sizes according to the volatile market conditions.
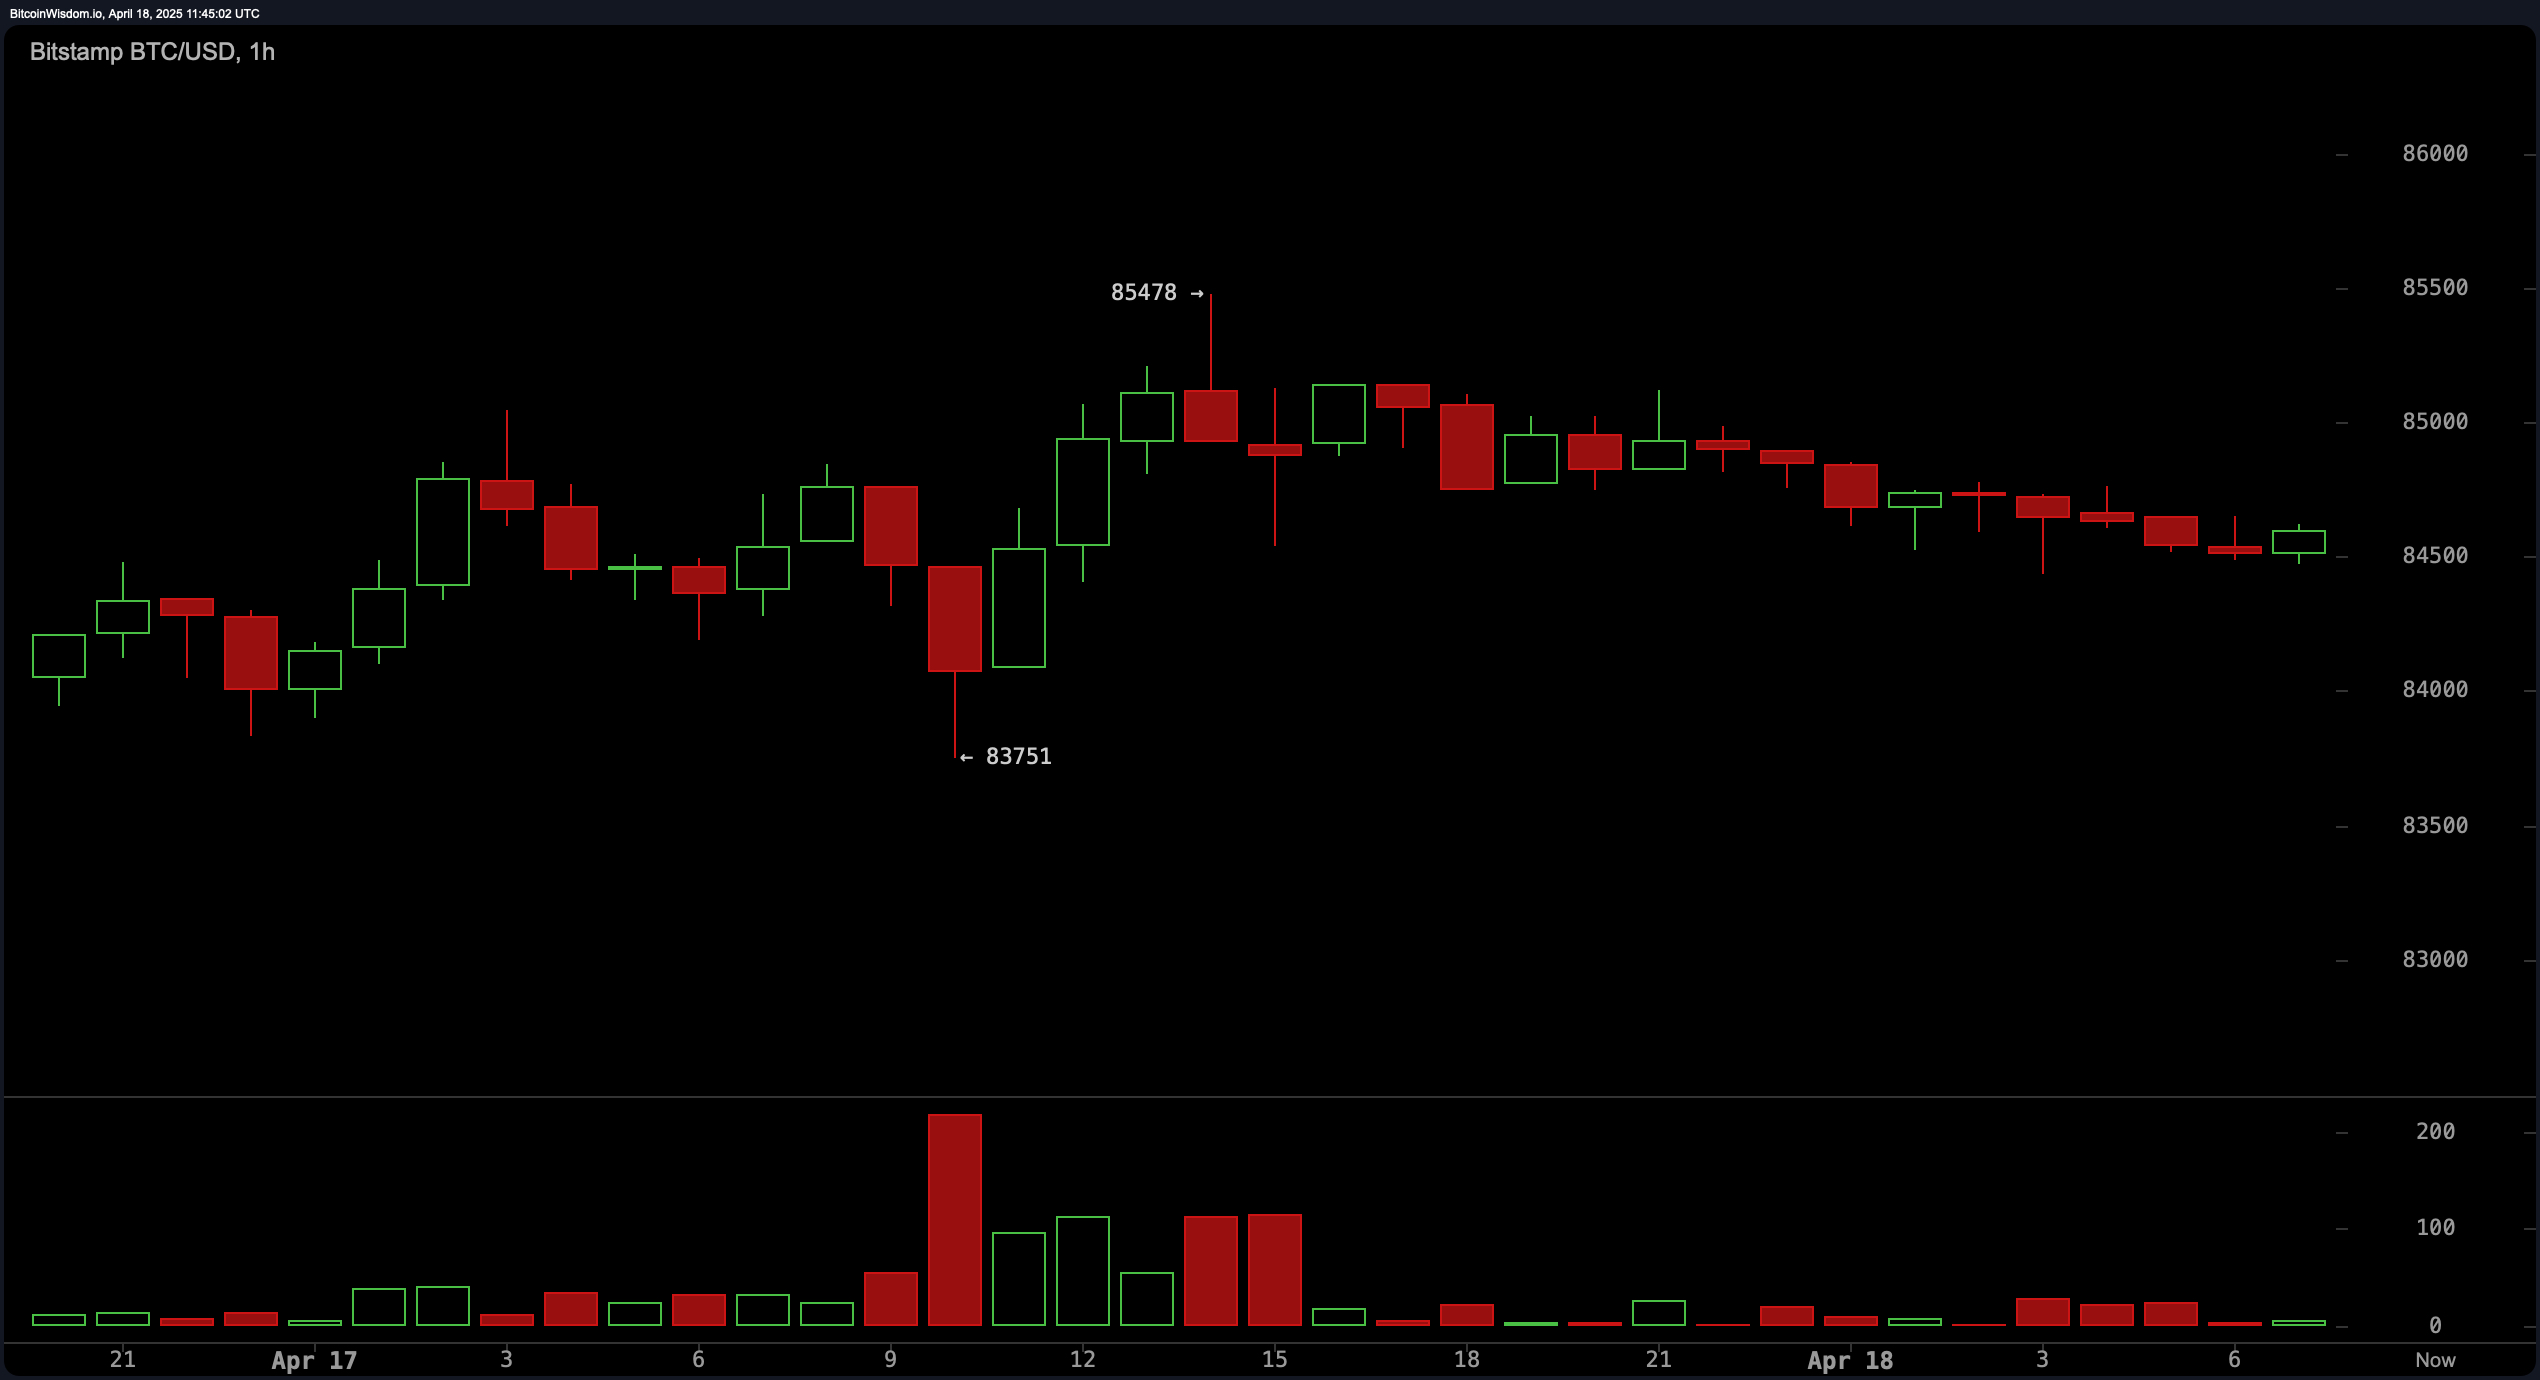
On the 1-hour Bitcoin chart, there’s been a downward trend forming as a channel since it reached approximately $85,478. Lately, its lowest points have been around $83,751. The immediate momentum seems quiet, implying that scalping within a range might be wiser than taking directional risks. Traders could consider bounces in the $83,750 to $84,000 range for potential long positions. A more significant drop below $83,750 on increased volume could intensify moves towards $83,000 and potentially lower levels.
Oscillators paint a mostly neutral picture, with relative strength index (RSI) at 52, Stochastic at 84, commodity channel index (CCI) at 76, average directional index (ADX) at 13, and awesome oscillator (AO) at 1,063, all signaling equilibrium. However, momentum (MOM) at 8,334 and moving average convergence divergence (MACD) level at –95 are flashing buy signals, indicating that the underlying force may be tipping in favor of bulls.
Moving averages (MAs) are skewed to the short term, with exponential moving average (EMA) values of 83,694 at 10 periods, 83,456 at 20 periods and 83,871 at 30 periods, alongside simple moving average (SMA) values of 83,635 at 10 periods, 82,656 at 20 periods and 83,577 at 30 periods, all in buy mode. On longer horizons, the 50‑period EMA at 85,332 and the 100‑period EMA at 87,458 sit in sell territory, as do the 100‑period SMA at 91,135 and both 200‑period EMAs and SMAs.
Bull Verdict:
If Bitcoin manages to break through the $86,000 level on the daily chart accompanied by a significant increase in trading volume, and maintains its position above both its 20-day and 30-day exponential moving averages, it’s likely that its bullish trend will propel it towards the $90,000 price range.
Bear Verdict:
As an analyst, I’m observing that if Bitcoin dips below the $82,000 support and approaches the ascending channel floor around $83,750 on heightened trading activity, it seems plausible that we might witness a more pronounced correction towards the mid-$70,000 range.
Read More
- Gold Rate Forecast
- Silver Rate Forecast
- Honor of Kings returns for the 2025 Esports World Cup with a whopping $3 million prize pool
- PUBG Mobile heads back to Riyadh for EWC 2025
- USD CNY PREDICTION
- Kanye “Ye” West Struggles Through Chaotic, Rain-Soaked Shanghai Concert
- Arknights celebrates fifth anniversary in style with new limited-time event
- Mech Vs Aliens codes – Currently active promos (June 2025)
- Every Upcoming Zac Efron Movie And TV Show
- Hero Tale best builds – One for melee, one for ranged characters
2025-04-18 15:59