Ah, the enigmatic Bitcoin, a creature of both fortune and folly, has settled at the princely sum of $109,718 as of this fine day, May 26, 2025. With a market capitalization that would make even the most stoic of investors raise an eyebrow—$2.18 trillion—and a trading volume that dances around $29.24 billion in the last 24 hours, one cannot help but marvel at the spectacle. The day’s price action, a veritable ballet, pirouetted between $106,802 and $110,078, showcasing a volatility that is both thrilling and terrifying.
Bitcoin
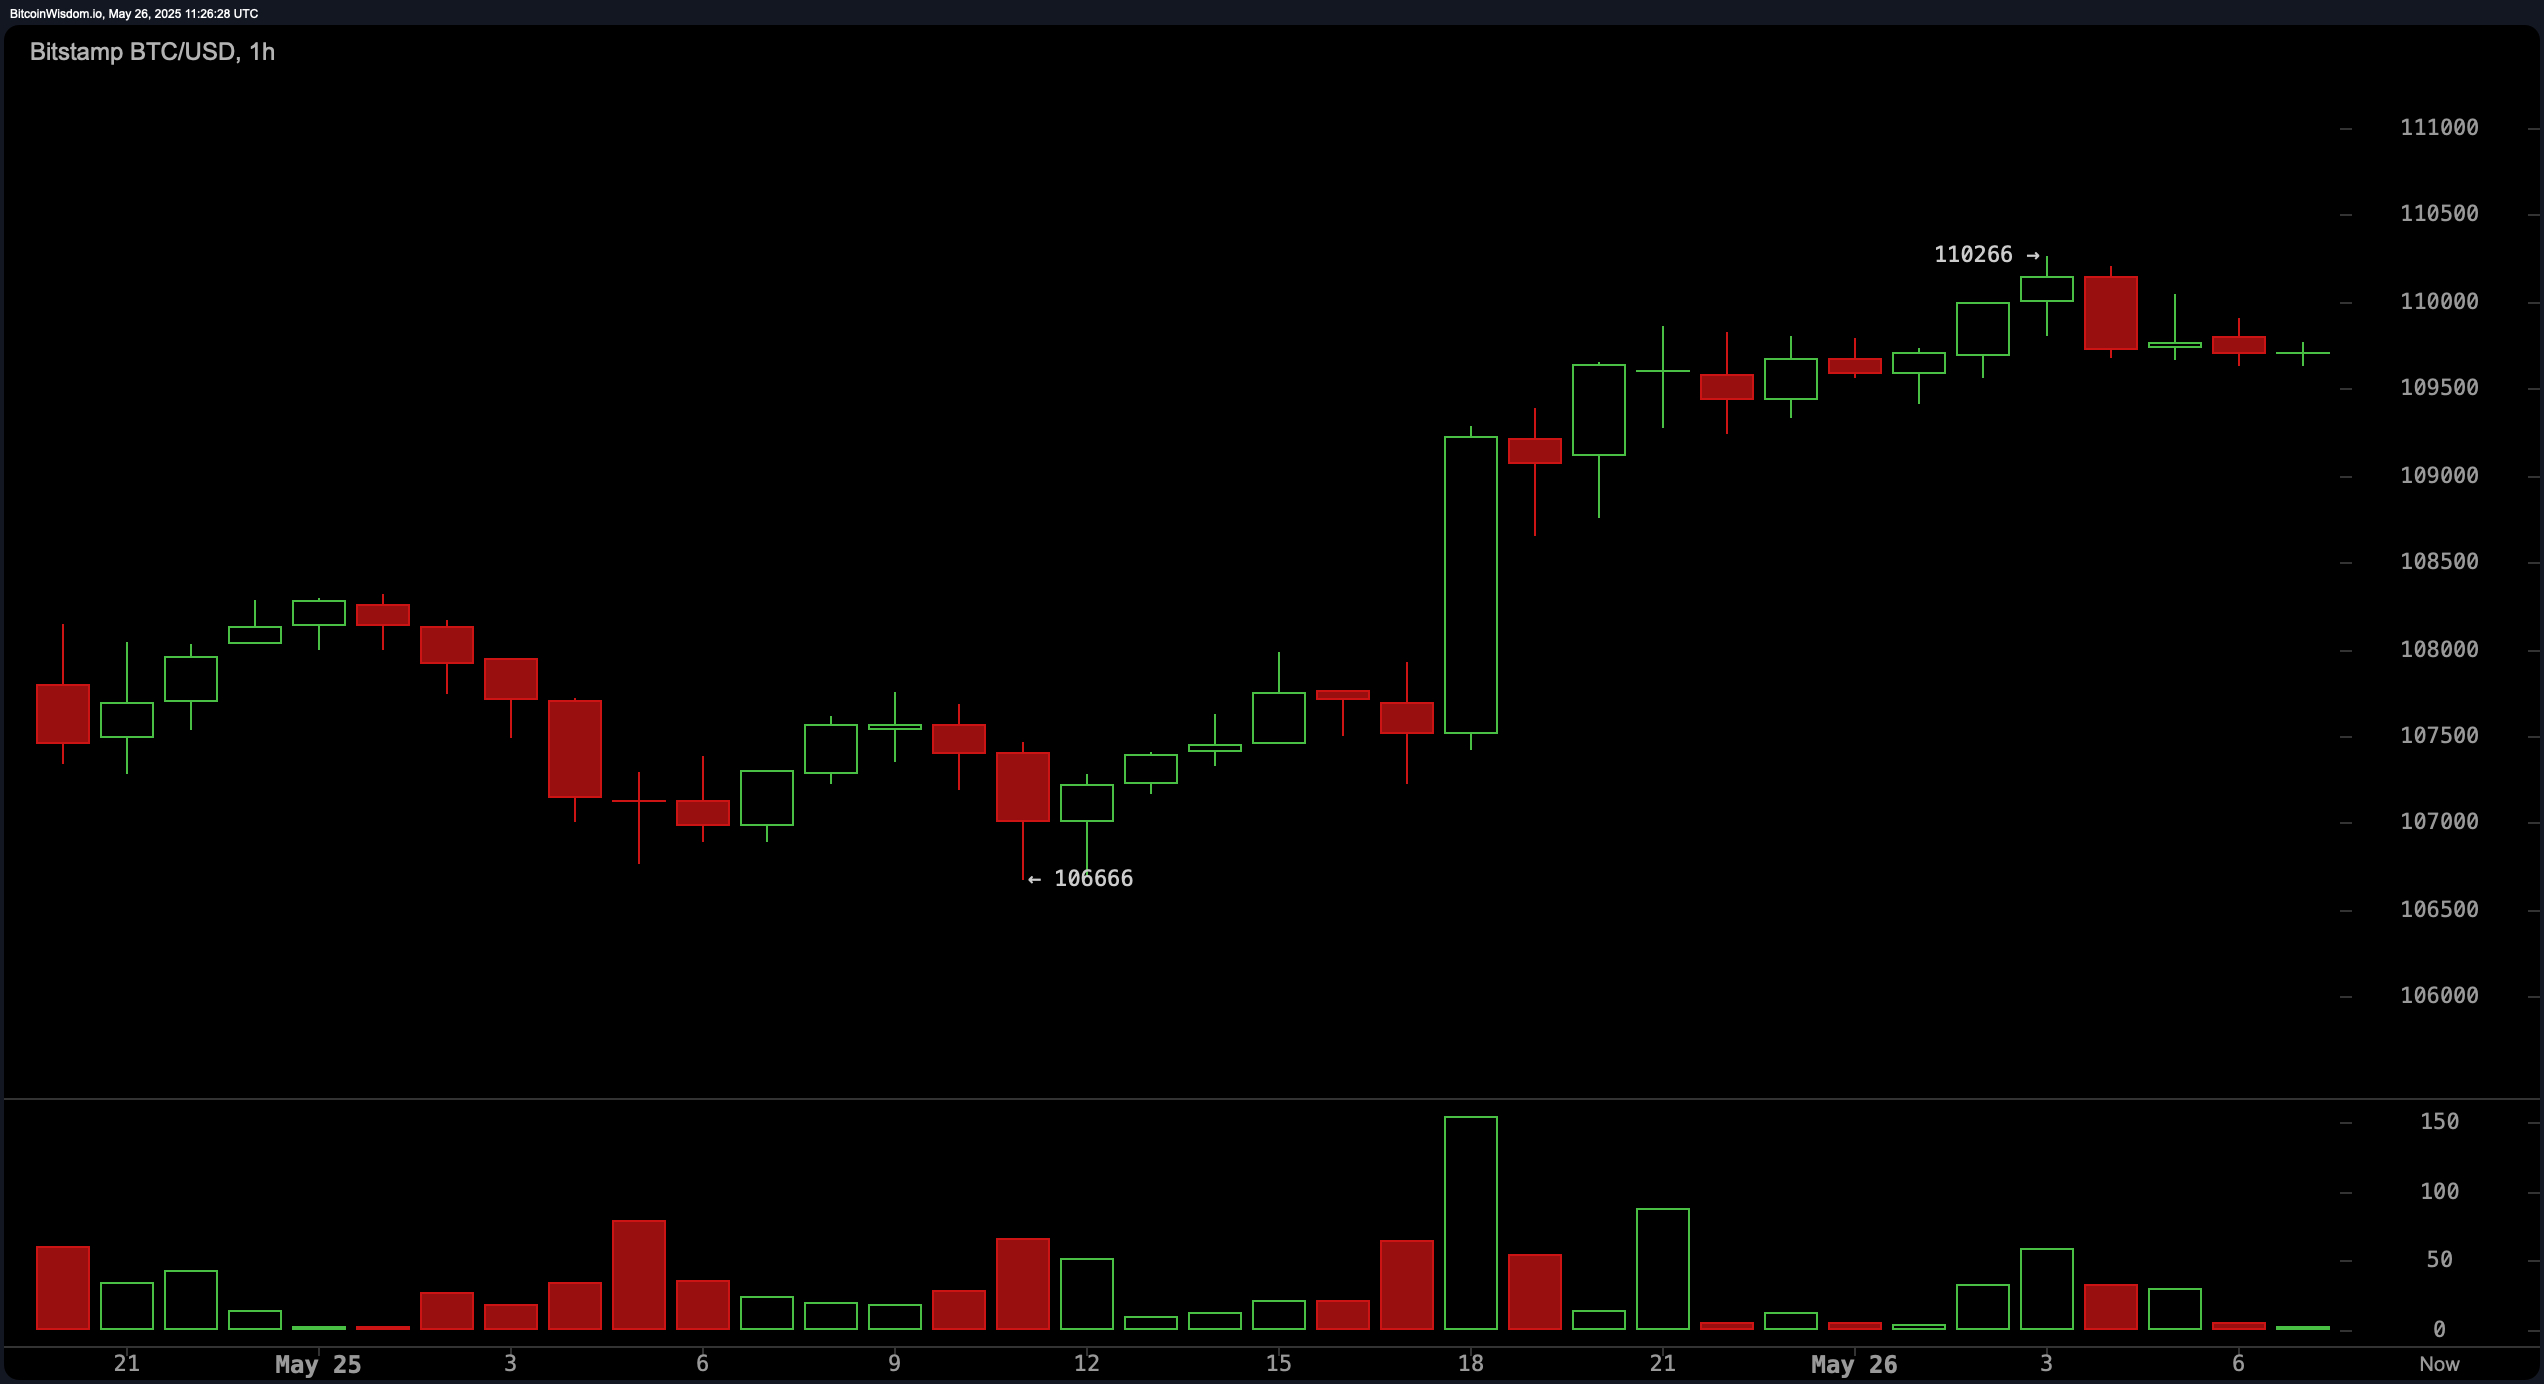
Our dear friend, the 1-hour chart, reveals a rather tumultuous trading environment. The bitcoin (BTC) has bounced from a local low of $106,666—oh, the irony!—back to the lofty heights of $110,000. Volume surged during this dip, likely a result of short-covering, only to dwindle during the recovery, suggesting that the buyers are perhaps not as convinced as one might hope. The current price behavior, a curious consolidation just below $110,000, speaks of indecision among traders. Opportunities for entry beckon near $109,000–$109,200, with stop-losses snugly placed below $108,500. Profit-taking near $110,500–$111,000 is wise, unless, of course, the momentum decides to surprise us all.
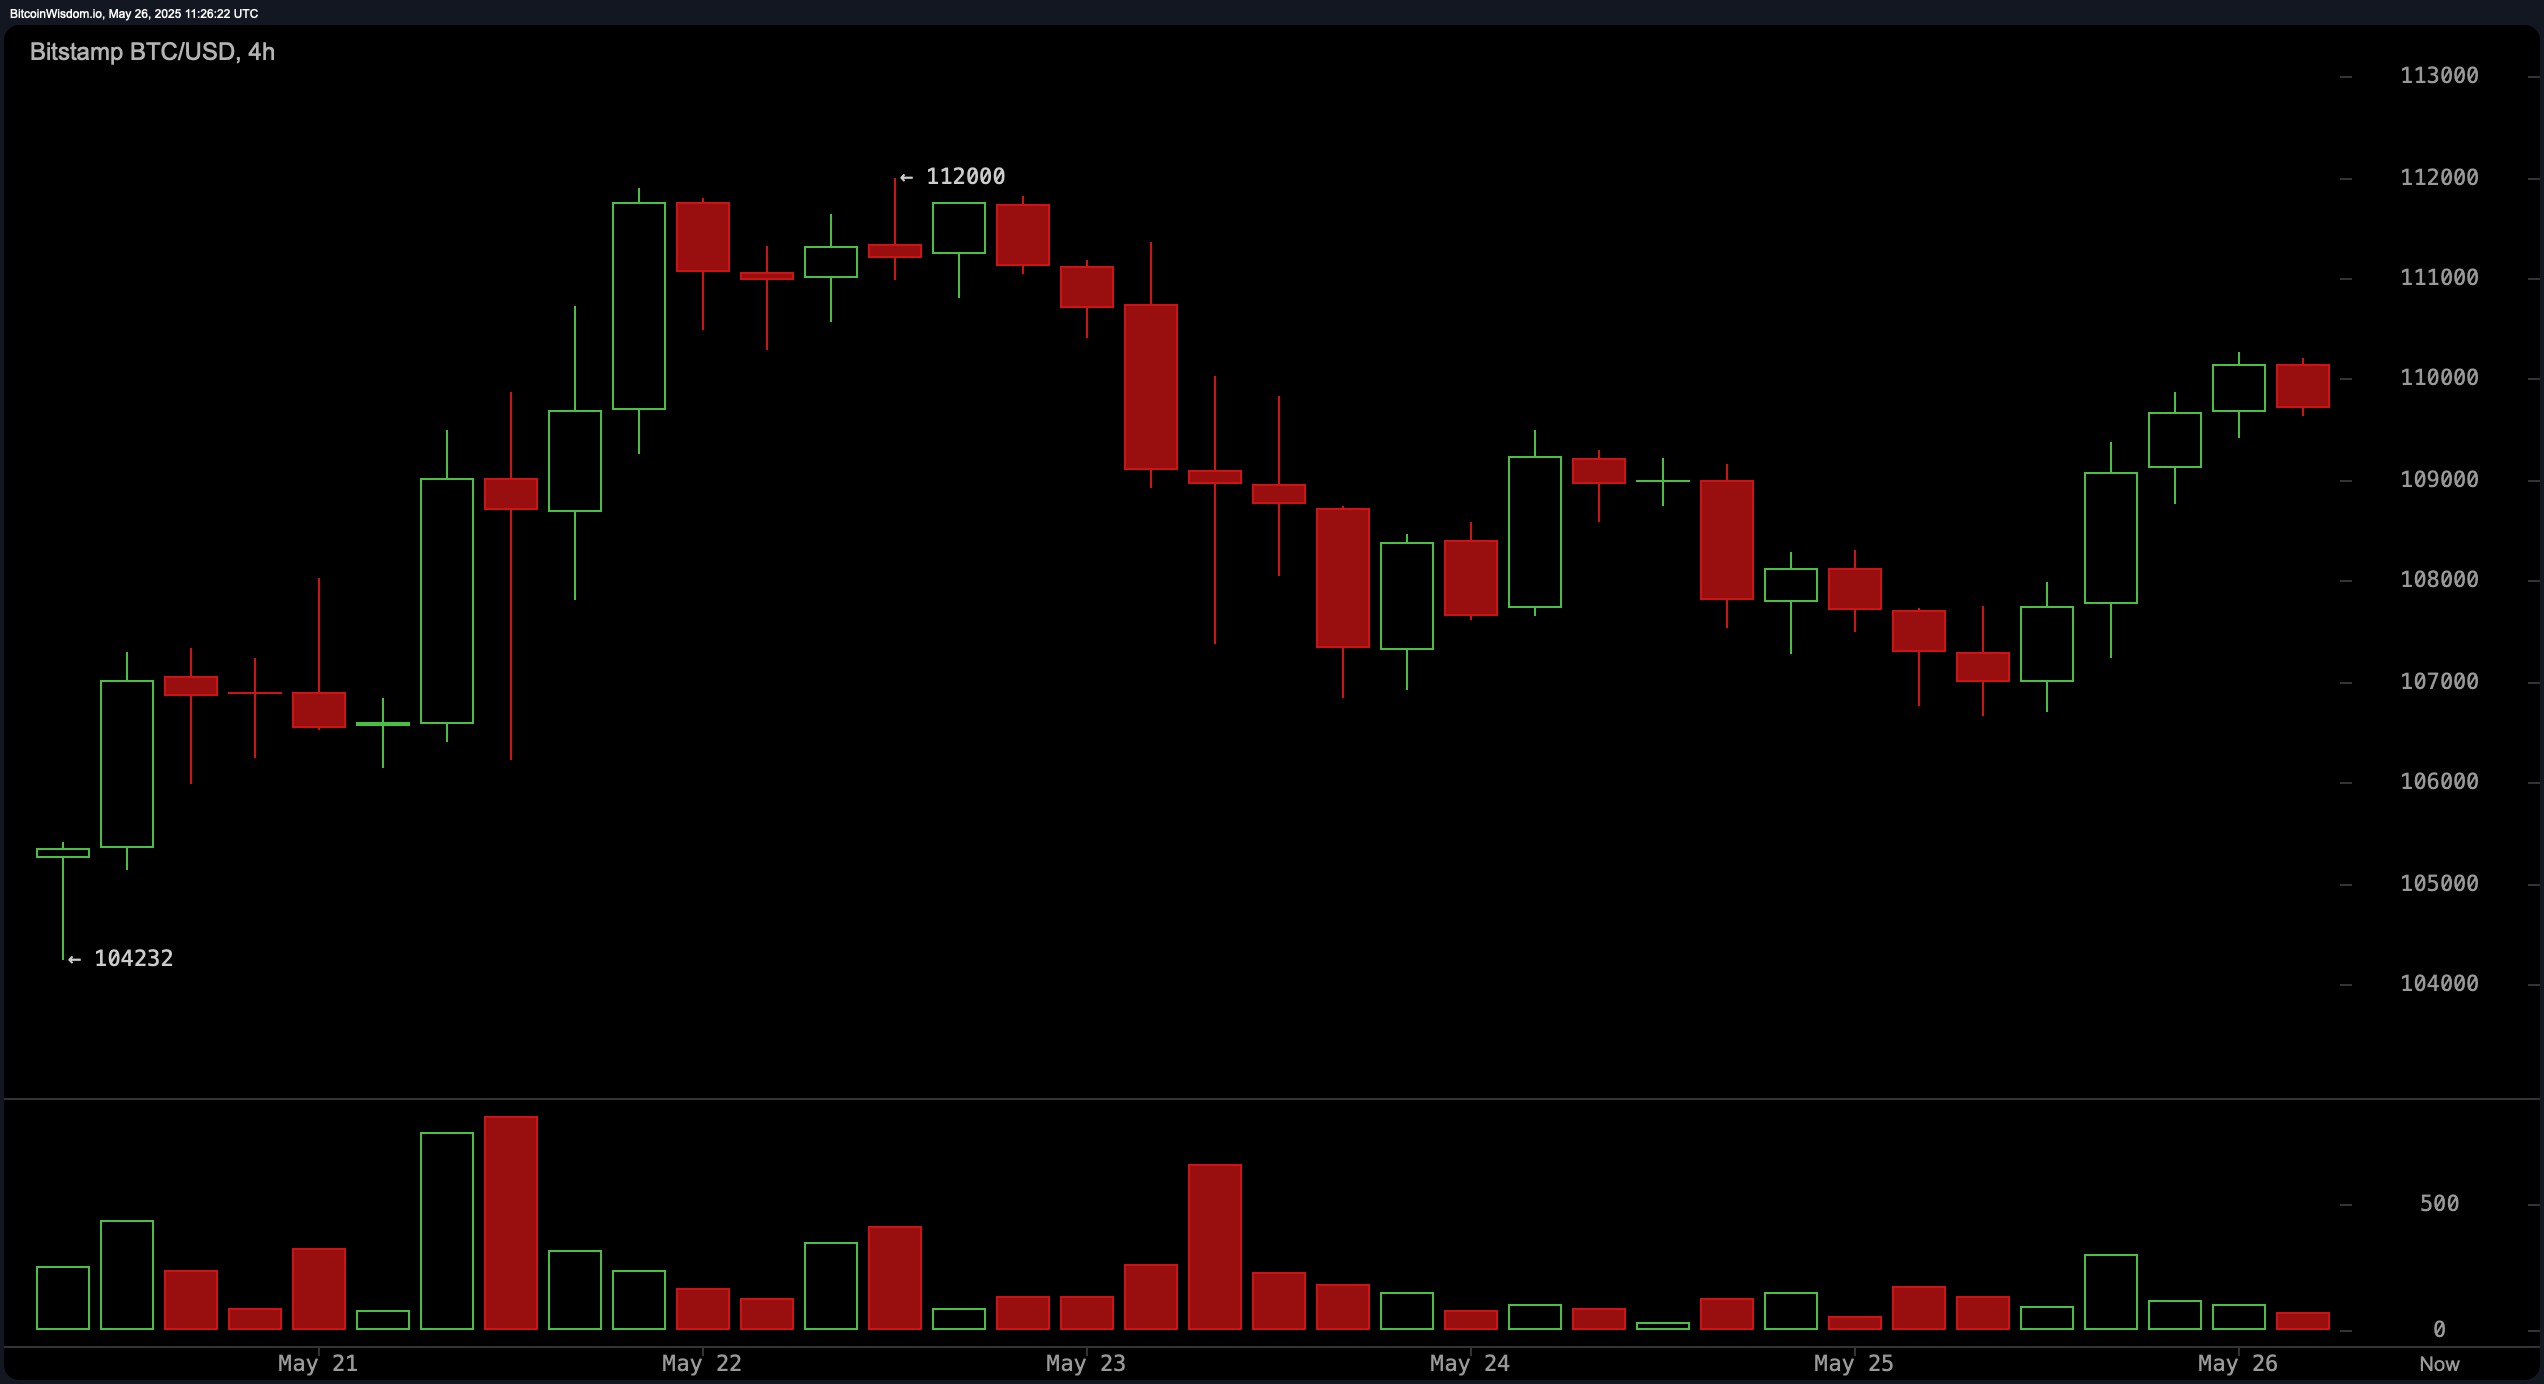
Turning our gaze to the 4-hour chart, we observe a minor downtrend from the recent peak of $112,000, descending to approximately $106,500, followed by a hesitant recovery. Alas, the volume during this recovery has thinned, hinting at a lack of fervor among the buyers. A bear flag pattern may be forming, characterized by a gentle upward drift post-drop on subdued volume. Should the price encounter rejection around $110,500–$111,000 with a flourish of volume, the bearish outlook could darken. Yet, should the bulls reclaim $111,000 with vigor, a breakout back toward $112,000 may be on the horizon.
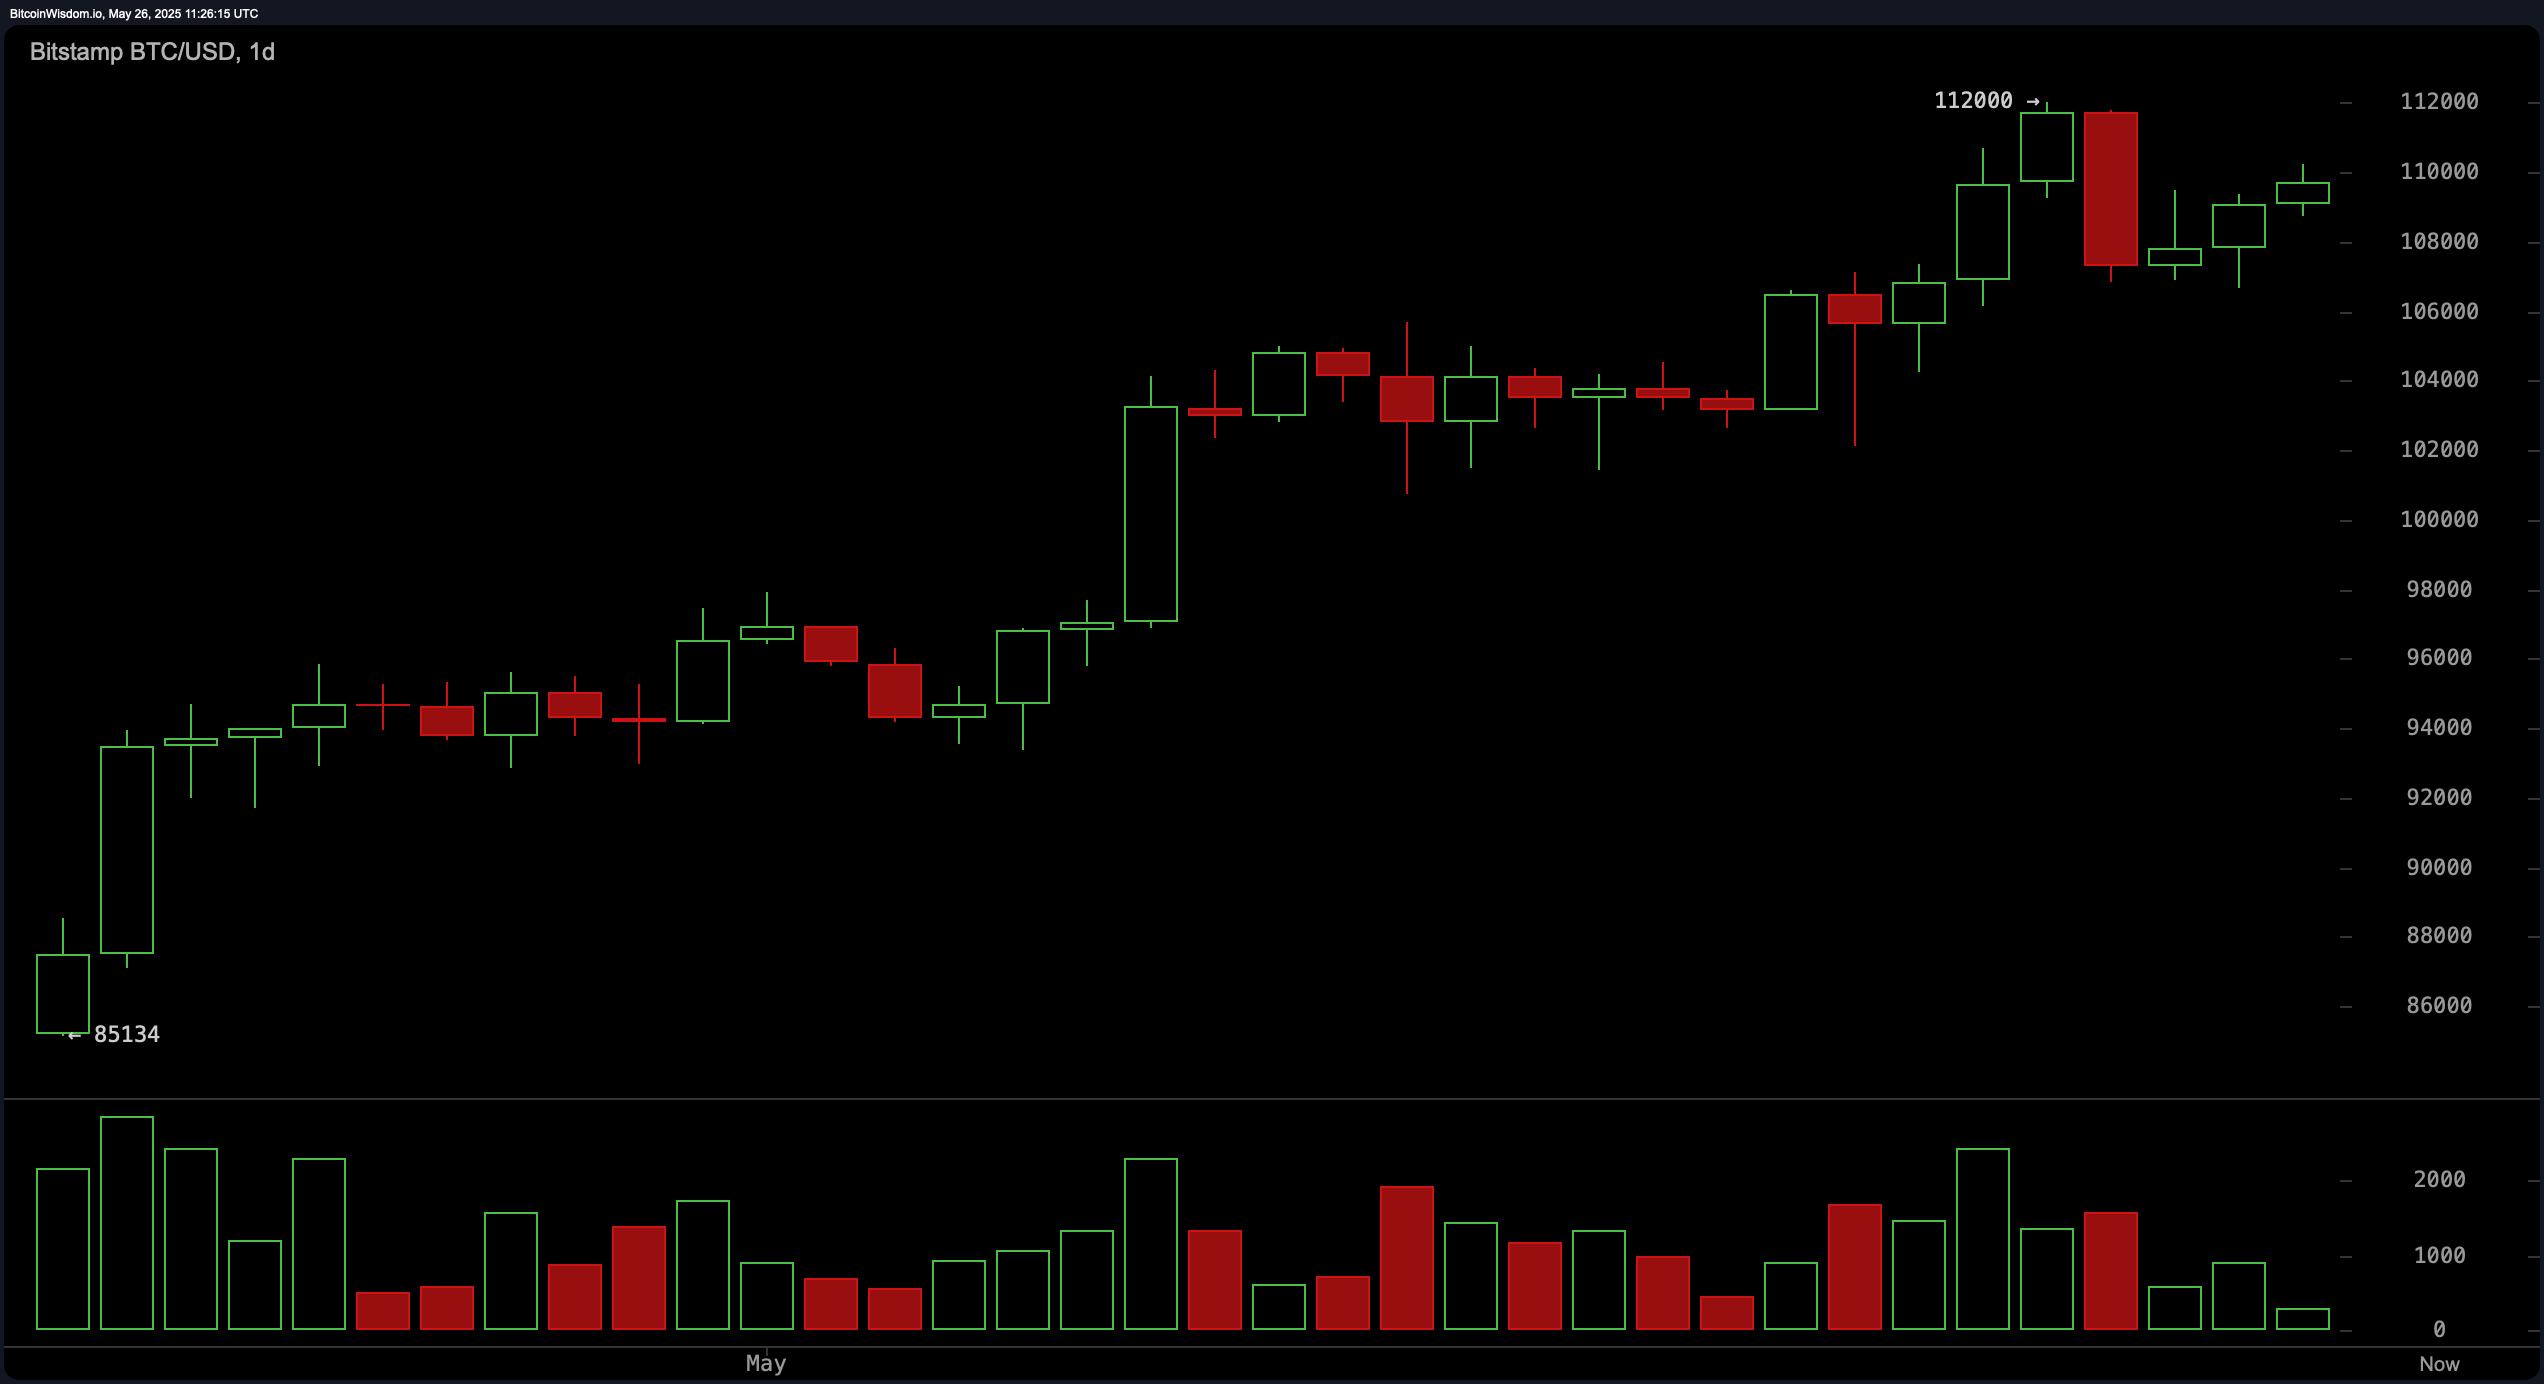
The daily chart, a broader canvas, reflects a bullish momentum that began in early May, peaking recently at $112,000 per BTC. Volume patterns support this uptrend, yet a notable red candle post-peak suggests a swift rejection at that resistance. Currently, the price finds solace within the $106,000–$108,000 consolidation zone. A pullback toward $108,000–$109,000 could present enticing long entries, particularly if accompanied by bullish candlestick formations. However, a failure to surpass the $112,000 mark on subsequent tests, especially amid declining volume, may trigger caution among buyers.
As we delve into the realm of oscillator readings, a nuanced perspective emerges. The relative strength index (RSI) stands at 67, suggesting our dear asset is tiptoeing into overbought territory, yet remains neutral. The Stochastic oscillator registers at 72, and the commodity channel index (CCI) at 118, both signaling neutrality. The average directional index (ADX) at 32 indicates a developing trend without extreme strength. While the momentum indicator shows a bullish signal at 6,214, the moving average convergence divergence (MACD) level at 3,793 signals a bearish divergence, presenting a mixed bag of oscillator sentiment that demands caution from traders.
In the world of moving averages (MAs), we find a uniformly bullish landscape. The exponential moving average (EMA) and simple moving average (SMA) across the 10, 20, 30, 50, 100, and 200-period settings all align in favor of a continued upward trend. Short-term EMAs, such as the 10-period EMA at $107,654 and 20-period EMA at $104,933, confirm bullish momentum with price action above these thresholds. Longer-term indicators like the 200-period EMA and SMA at $89,874 and $94,143 respectively underline a strong foundational trend. These aligned averages reinforce the bullish structure unless disrupted by a volume-driven reversal.
Fibonacci retracement levels, our trusty compass, further clarify support and resistance. On the daily chart, key levels include 38.2% at $101,737 and 50% at $98,567, both representing strong support should Bitcoin experience profit-taking. For the 4-hour chart, the 38.2% to 50% range between $109,032 and $108,116 is critical due to its confluence with volume clusters, making it a likely buy zone upon retest. On the 1-hour chart, the retracement levels between 50% ($108,466) and 61.8% ($108,041) present ideal zones for short-term scalping, with stops set below the 78.6% retracement at $107,436. These retracement clusters provide precision in risk management and entry planning.
Bitcoin’s strong positioning above all major moving averages, coupled with bullish momentum on higher timeframes and a well-supported price base around $106,000–$108,000, supports a continuation of the uptrend. If the price reclaims $111,000 with convincing volume, a breakout to new highs above $112,000 appears likely. 🐂💪
Bear Verdict:
Despite a broadly bullish structure, the presence of a potential bear flag on the 4-hour chart and mixed oscillator signals—including a sell from the MACD—introduce downside risk. A failure to reclaim $111,000 or a rejection accompanied by high volume could catalyze a deeper pullback toward the 38.2% or 50% Fibonacci retracement levels near $101,737 or $98,567. 🐻😱
Read More
- Silver Rate Forecast
- Former SNL Star Reveals Surprising Comeback After 24 Years
- Gold Rate Forecast
- USD CNY PREDICTION
- Black Myth: Wukong minimum & recommended system requirements for PC
- Grimguard Tactics tier list – Ranking the main classes
- 10 Most Anticipated Anime of 2025
- Arknights celebrates fifth anniversary in style with new limited-time event
- Hero Tale best builds – One for melee, one for ranged characters
- Box Office: ‘Jurassic World Rebirth’ Stomping to $127M U.S. Bow, North of $250M Million Globally
2025-05-26 15:28