Oh, Ethereum. That lovable rollercoaster ride we can’t seem to get off of. The price? It’s in a deep bear market, which, let’s be real, isn’t exactly breaking news. It’s down a whopping 53% since its November high. *Yikes.*
And guess what? It’s now hovering below the $2,000 support level, practically throwing a pity party at its lowest point since November 6. Ethereum, why do you do this to us?
So what’s causing this drama? Well, demand for Ethereum has been about as strong as a soggy handshake on Wall Street. All spot Ethereum ETFs have had outflows for the past three weeks. The grand total of those outflows? A staggering $2.52 billion. If you’re counting, that leaves us with just $6.72 billion in total assets. How cozy.
And don’t even get me started on the crypto market fear. The fear and greed index has dropped to a deliciously low 21—yep, we’re officially in the “fear zone” folks. And when investors are scared, Bitcoin and altcoins tend to join the pity party. Not exactly a winning formula.
Meanwhile, Ethereum Foundation has been doing its own little thing, like selling off ETH tokens. Not helpful, especially when a former engineer at the foundation, Harikrishnan Mulackal, basically threw shade by warning that Ethereum’s future is hanging by a thread. No pressure, right?
Ethereum is also facing some stiff competition from layer-1 chains like Solana (SOL) and BSC Chain, who are out there flexing on Ethereum’s turf. According to DeFi Llama (because, sure, that’s a thing), Ethereum’s DEX protocols only handled $1.012 billion in token volume on Monday. Compare that to BSC’s $1.63 billion and Solana’s $1.077 billion, and… well, we see the problem.
Ethereum Price Forms Another Risky Pattern
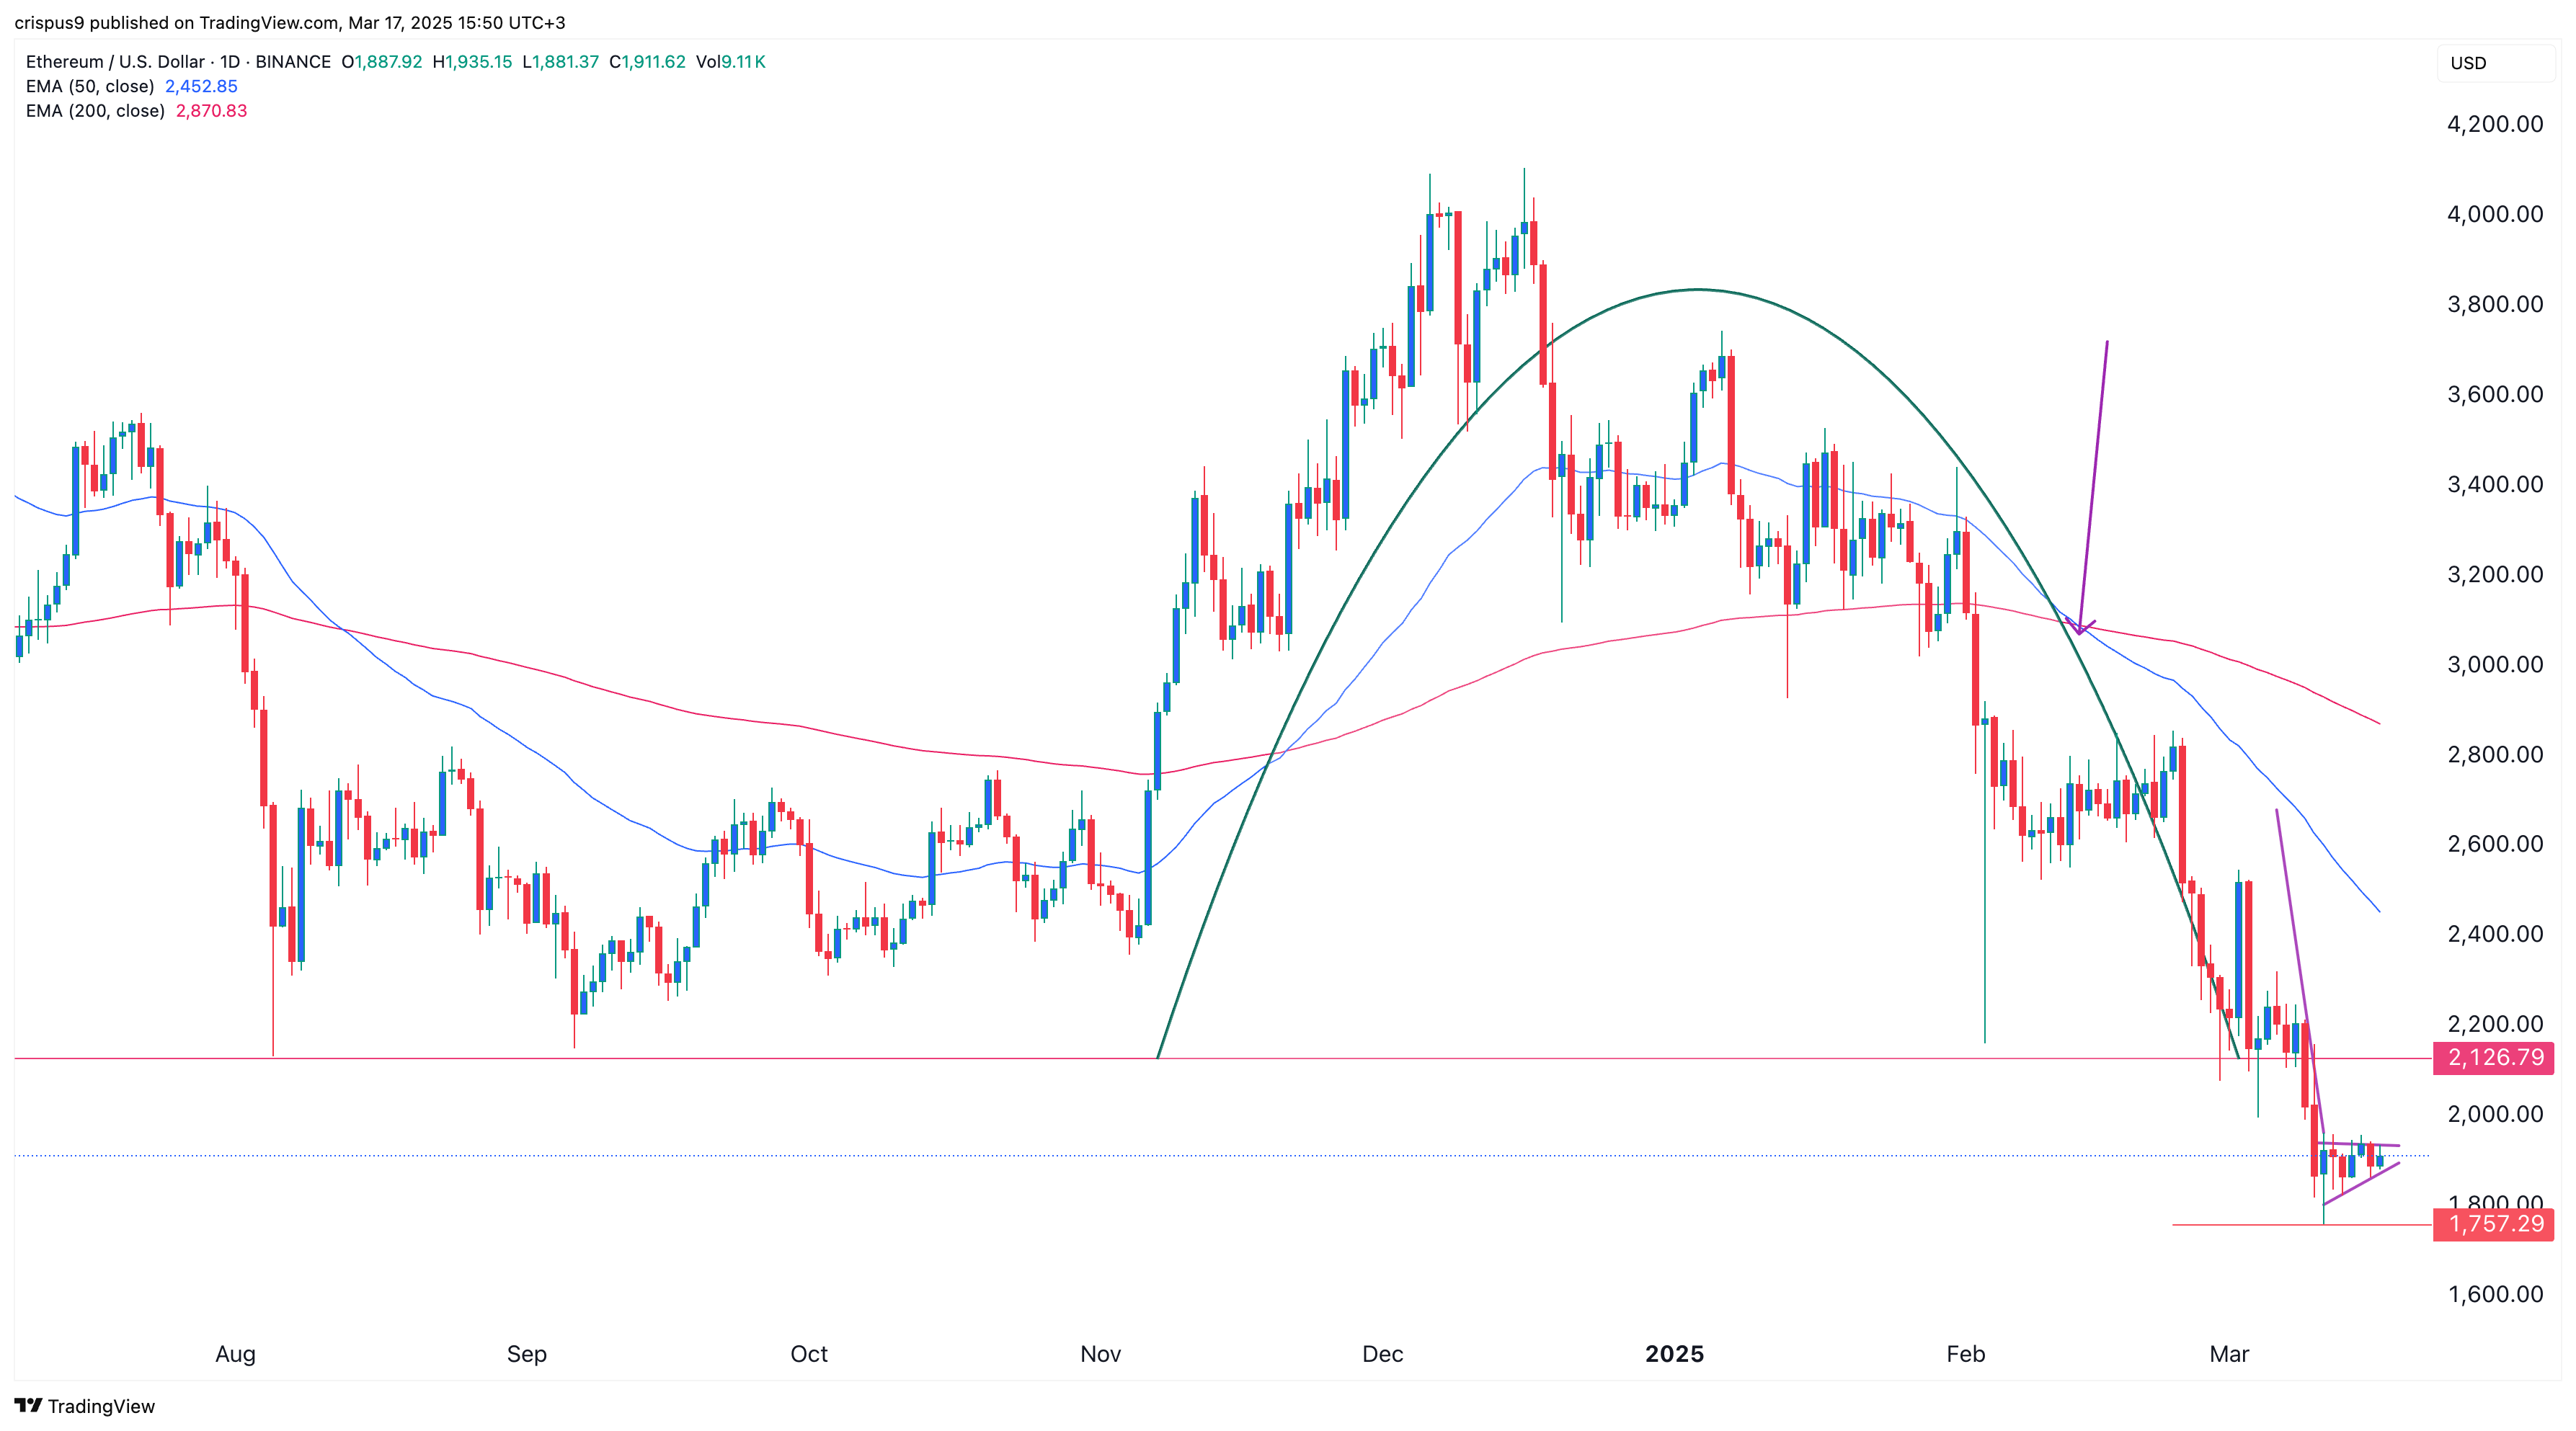
Brace yourselves—Ethereum’s price has decided to go full drama queen and form a triple-top pattern on the weekly chart. For those of you keeping track, that means it’s made three peaks with a neckline around $2,126. *Fascinating.*
Oh, but wait, there’s more! Ethereum’s price also gave us a delightful “death cross” on the daily chart when the 50-day and 200-day moving averages decided to cross paths on February 13. For those of you who don’t speak technical analysis, this is basically the market’s way of saying, “Things are about to get ugly.”
Now, ETH is on the verge of another juicy bearish pattern: a pennant. This little beauty consists of a long vertical line followed by a symmetrical triangle. And as the triangle approaches its confluence point, we’re all just waiting for the inevitable *bearish breakdown* to hit. Tick-tock, Ethereum, tick-tock.
So, what’s the takeaway? If ETH drops below the year-to-date low of $1,757, it’s probably going to head straight for that psychological $1,500 level. Fun, right?
But hey, there’s a silver lining—maybe. The Federal Reserve is making an interest rate decision this week, and if they go all “dovish,” ETH and other cryptocurrencies might get a little lift. But don’t hold your breath.
Read More
- Silver Rate Forecast
- Gold Rate Forecast
- Gods & Demons codes (January 2025)
- Honor of Kings returns for the 2025 Esports World Cup with a whopping $3 million prize pool
- Mech Vs Aliens codes – Currently active promos (June 2025)
- Superman: DCU Movie Has Already Broken 3 Box Office Records
- Grimguard Tactics tier list – Ranking the main classes
- Former SNL Star Reveals Surprising Comeback After 24 Years
- USD CNY PREDICTION
- Kanye “Ye” West Struggles Through Chaotic, Rain-Soaked Shanghai Concert
2025-03-17 16:17