Ah, the world of cryptocurrency! It’s a bit like a rollercoaster ride, but instead of screaming, you just stare in disbelief as the frog-themed meme coin, PEPE, takes a nosedive. 🐸💔 While the broader crypto market is experiencing a cooling period (read: it’s as chilly as a penguin’s backside), our froggy friend PEPE is taking a sharper hit than a toddler with a sugar rush. Over the past 24 hours, it has plummeted roughly 11%, trading at a staggering $0.00001288. Yes, you read that right—less than a penny! 💰
In a shocking turn of events, PEPE’s market cap has shed more than $650 million in just one day. That’s right, folks! It’s now standing at a mere $5.42 billion. This drop coincides with a whale’s major exchange deposit. And no, I’m not talking about a marine mammal; I mean a crypto whale! 🐋
According to the ever-reliable on-chain data from Lookonchain, whale 0x3c9E decided to deposit a whopping 502.5 billion PEPE tokens, valued at $6.47 million, onto Binance. And just to keep things interesting, this whale still holds 497.5 billion PEPE worth $6.41 million. Talk about a hoarder! 🤑
PEPE whale 0x3c9E deposited 502.5B $PEPE($6.47M) to #Binance 20 minutes ago and still holds 497.5B $PEPE($6.41M).
This whale has made a profit of $7.47M on $PEPE in just one month.
— Lookonchain (@lookonchain) May 30, 2025
Now, this whale has already netted a cool $7.47 million in profit over the past month, raising market concerns about a possible sell-off. Because who wouldn’t want to cash in on a froggy fortune? 🐸💸
PEPE Price Outlook
On the daily PEPE price chart, the RSI currently indicates that our beloved meme coin is nearing oversold territory but hasn’t quite hit rock bottom yet. Traders can find immediate support in the $0.0000120–$0.0000124 demand zone. A break below this zone could lead to a deeper correction to $0.0000100. Yikes! 😱
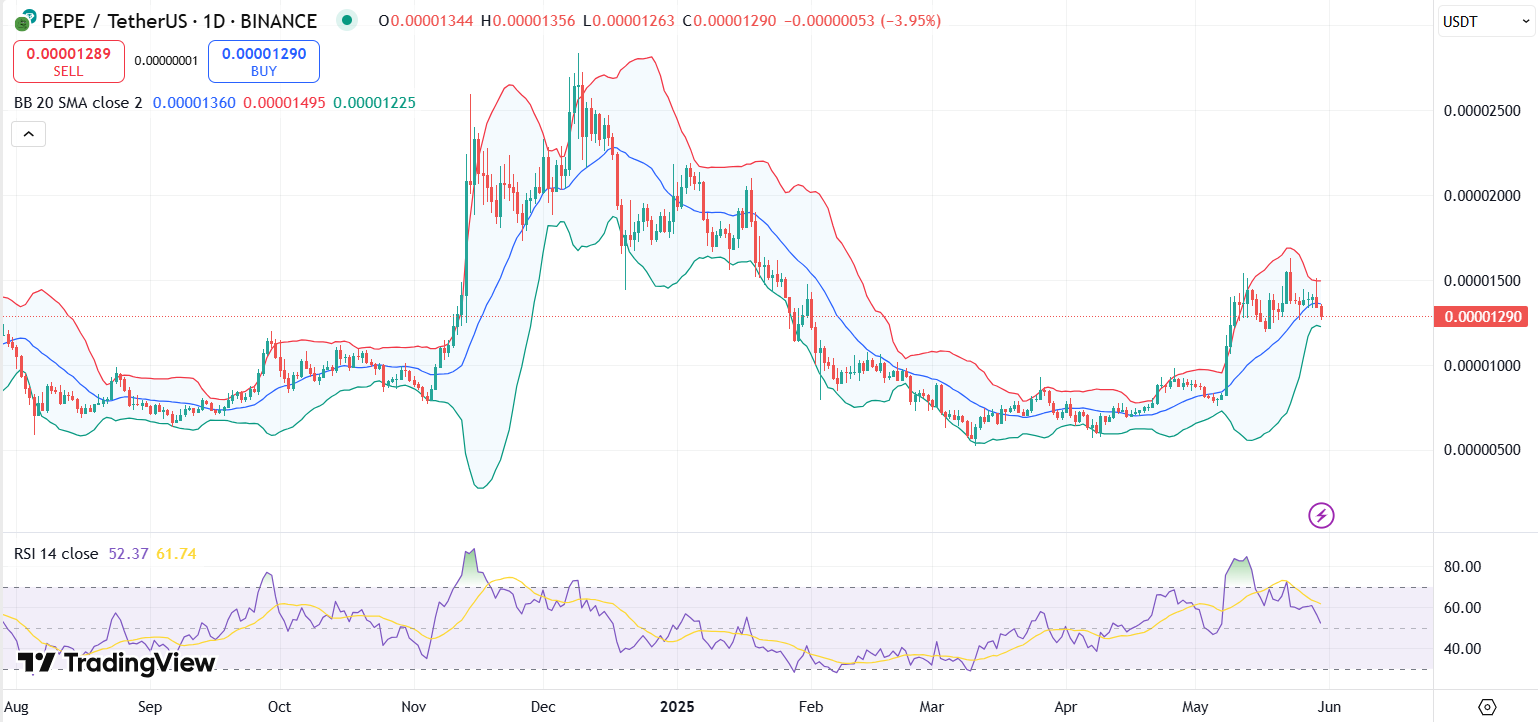
PEPE price chart with RSI and Bollinger Bands | Source: Trading View
Price candles have slipped below the mid-Bollinger Band (20-day SMA) and are brushing against the lower band, which is often a signal that the asset is oversold in the short term. This suggests that a reversal could happen if buying pressure increases. Resistance lies around $0.0000135, followed by the critical $0.000015 psychological level. But if prices continue to hug the lower band, it may indicate sustained bearish pressure. 🐻
Meanwhile, the MACD line has recently crossed below the signal line, and the gap is widening. This bearish crossover typically results in downward movement. It’s like watching a sad movie where you know the ending is not going to be happy. 😢
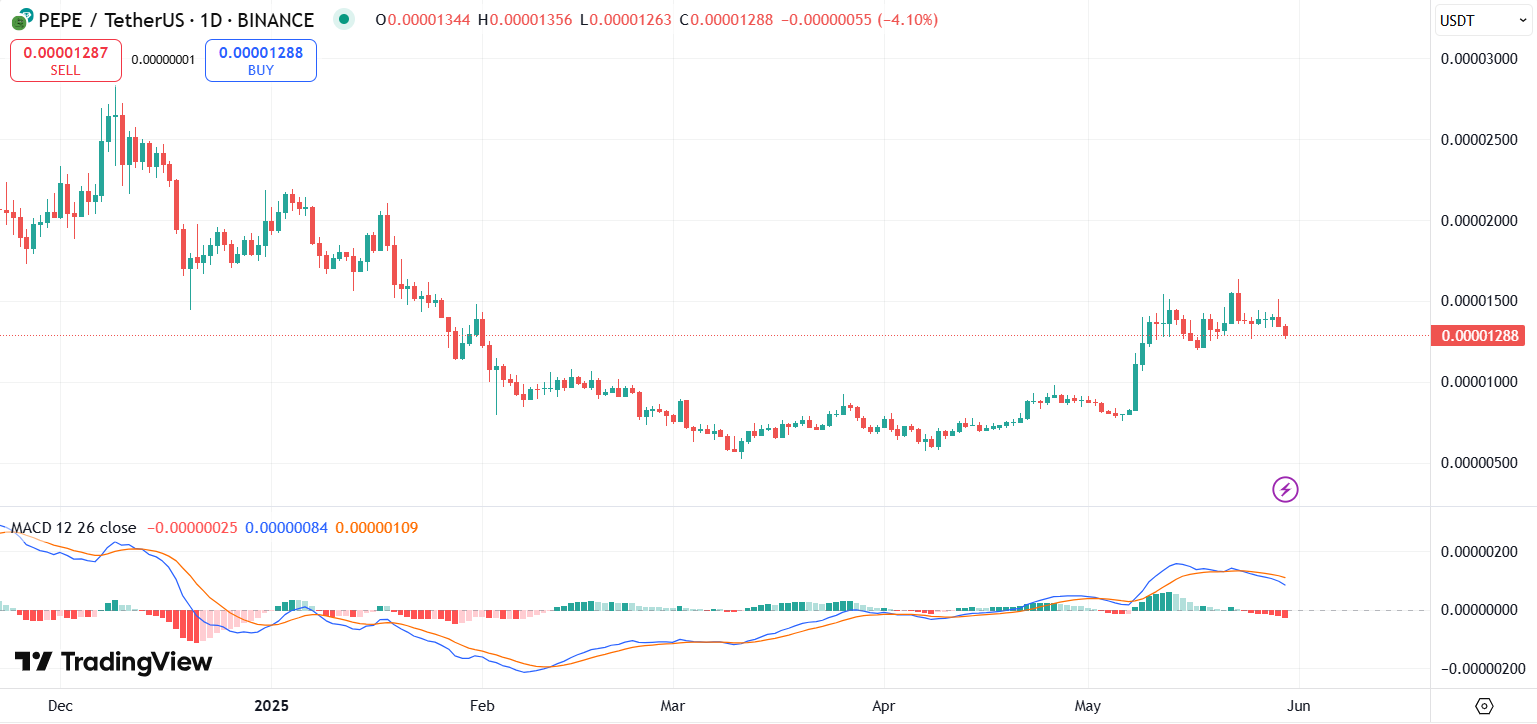
PEPE price chart with MACD | Source: Trading View
Earlier in May, PEPE recorded a sharp rebound from $0.000006, rallying 45% in the past month. However, current conditions suggest that the bulls are losing steam. Despite the recent dip, PEPE remains one of the best meme coins and among the largest by market cap, maintaining a multibillion-dollar valuation and strong market presence. 🐸💪
According to the popular X crypto account PEPE ON FIRE, the token is clinging to a regression trend with support at $0.000013. They believe that a clean breakout above this level could lead the meme coin to the $0.000025 zone. Fingers crossed! 🤞
$PEPE currently has a support level at $0.000013, and it’s following a regression trend. A breakout above this level could indicate a bullish move, potentially targeting the $0.000025 range.#PEPE
Join here for more updates about $PEPE:
— PEPE ON FIRE 🔥 (@PepeCZBinance) May 30, 2025
Read More
- Gold Rate Forecast
- Silver Rate Forecast
- Honor of Kings returns for the 2025 Esports World Cup with a whopping $3 million prize pool
- PUBG Mobile heads back to Riyadh for EWC 2025
- USD CNY PREDICTION
- Kanye “Ye” West Struggles Through Chaotic, Rain-Soaked Shanghai Concert
- Arknights celebrates fifth anniversary in style with new limited-time event
- Hero Tale best builds – One for melee, one for ranged characters
- Every Upcoming Zac Efron Movie And TV Show
- Grimguard Tactics tier list – Ranking the main classes
2025-05-30 17:32