Well, well, well, Pi Network (PI) is taking a nosedive—down nearly 15% in the last seven days and 4.4% in just the past 24 hours. Now sitting at a cozy $5.12 billion market cap, its trading volume has jumped 25% in the past day, hitting a casual $104.6 million. Talk about a wild ride! 🚀 Or should I say, a downhill slide? 😬
Technical indicators like the ADX, CMF, and EMA structure are all flashing warning signs like a neon billboard. It’s clear: selling pressure is ramping up, and PI’s price is struggling to hold onto any kind of support. Hold on tight, folks—unless something drastic changes, this might get even uglier. 😏
Pi Network’s Downward Spiral: Buckle Up!
The Directional Movement Index (DMI) chart for Pi Network (PI) is showing an interesting jump in the Average Directional Index (ADX)—from 11.46 to 21. That’s a big leap for a number that typically says, “Hey, no trend here.” But now? Well, now it’s giving us the signal that a trend, probably the bearish kind, is strengthening.
Generally, an ADX under 20 suggests a weak market, but with the ADX climbing past that threshold? Buckle up, buttercup! This might be a strong, cold wind pushing PI down further.
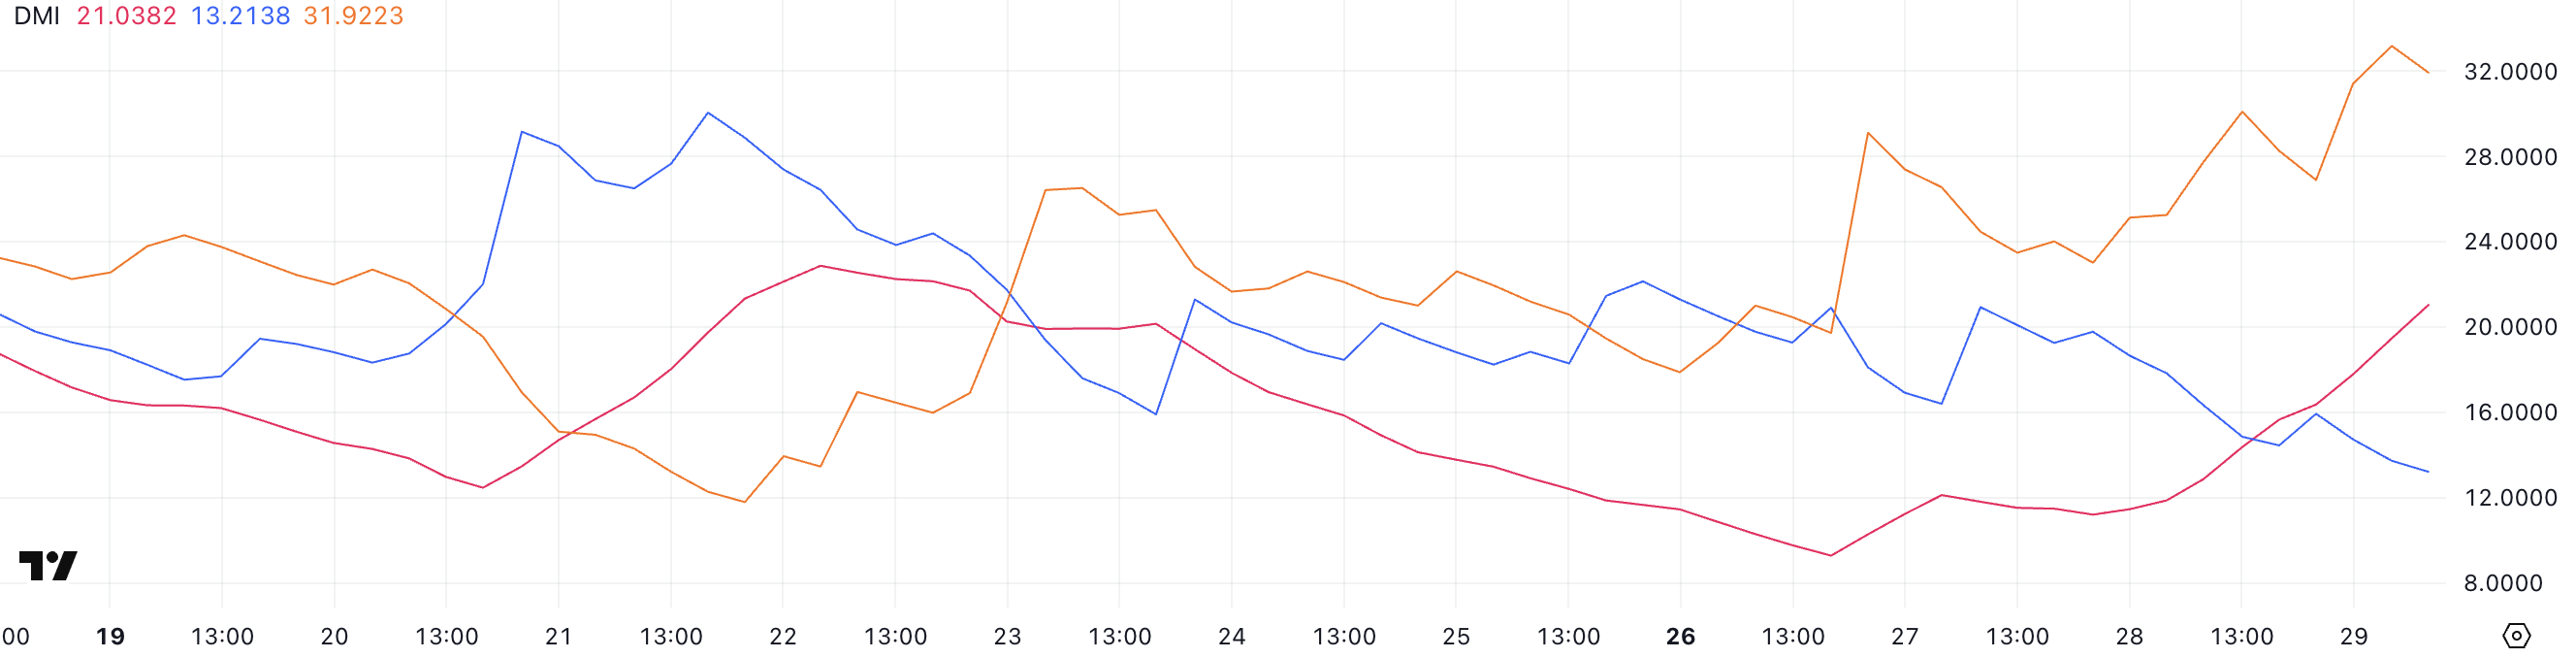
If you dive into the numbers, you’ll see that the +DI (Positive Directional Indicator) has dropped from 20.93 to 13.21, while the -DI (Negative Directional Indicator) has spiked from 23.48 to 31.92. Ouch! That widening gap tells you all you need to know—the bears are in full control. When the -DI climbs over +DI like that, it’s usually a sign that a downtrend is gaining serious momentum.
So, yeah—PI is pretty much heading south unless something crazy happens. Watch this space, traders. 👀
Indicators: A Hard Sell
The Chaikin Money Flow (CMF) for Pi Network (PI) has taken a nosedive from +0.08 to -0.20 in just a few days. That’s a big ol’ red flag waving in your face.
Now, the CMF is a volume-weighted indicator that tells you whether money is coming in (good) or going out (bad). When it drops below zero, that’s a signal that more people are bailing than buying. And right now? Well, let’s just say the CMF is making it clear that sellers are in control.
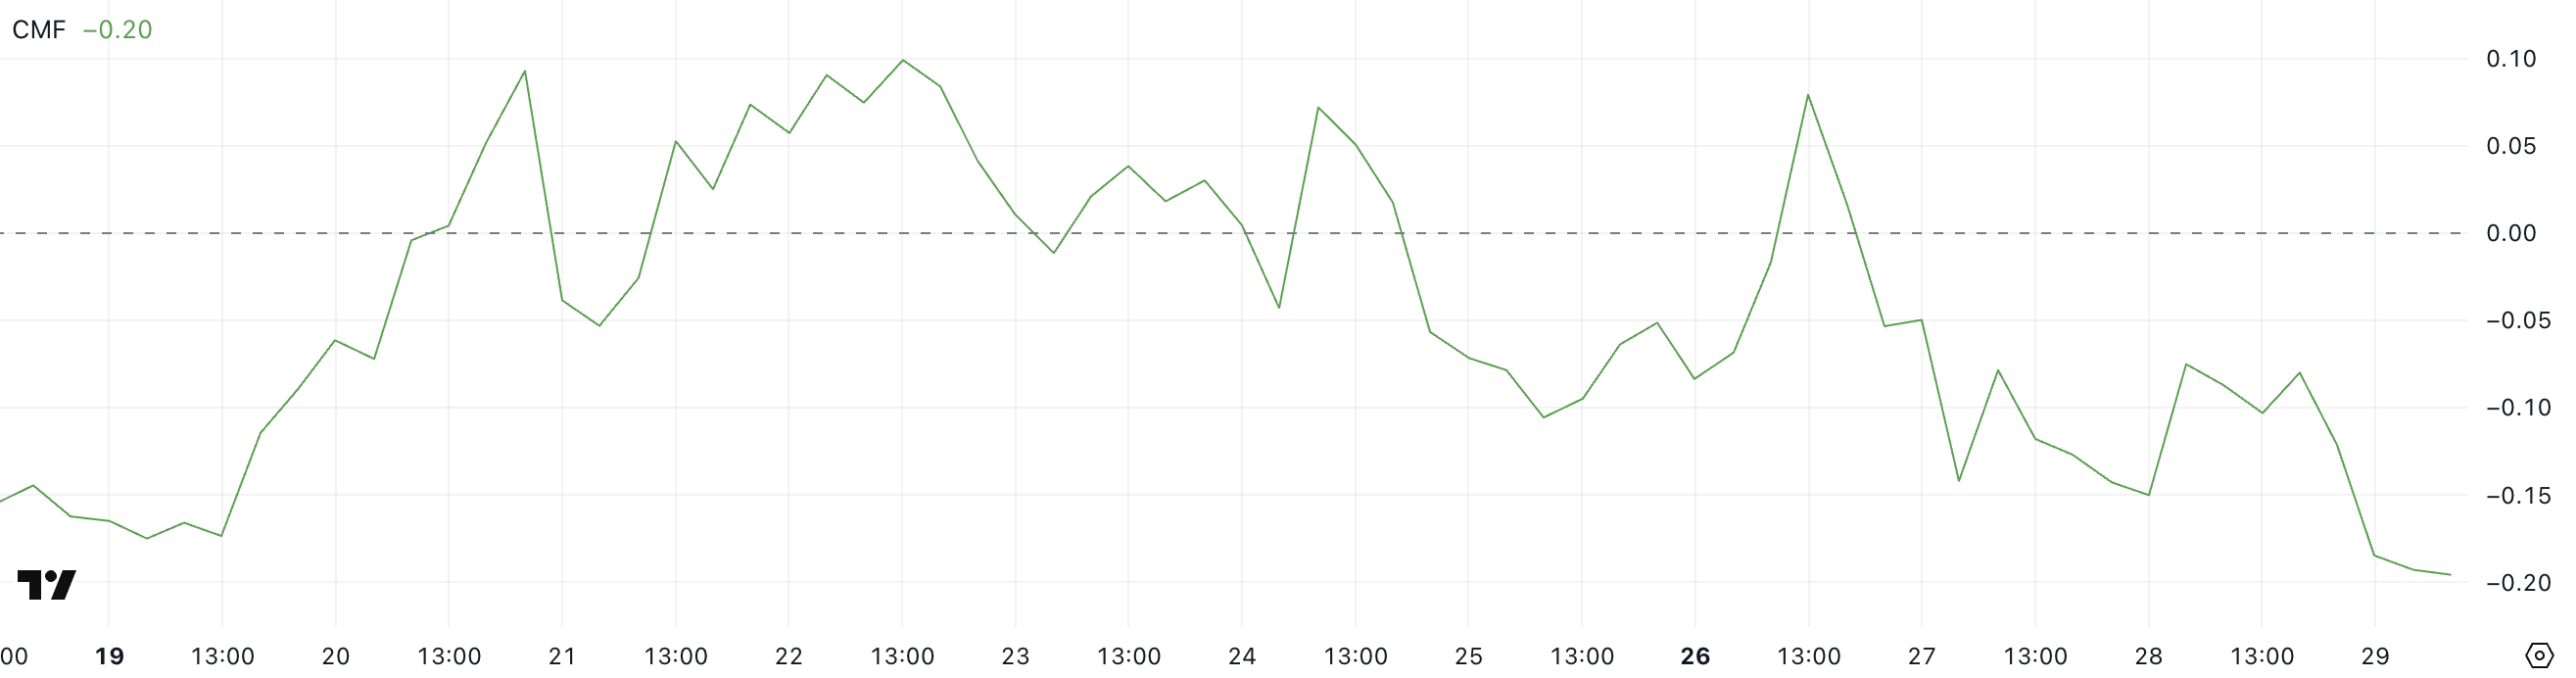
With PI’s CMF now sitting at a hearty -0.20—its lowest since May 17—it’s hard to see this as anything but bad news. As this indicator continues to plummet, it suggests there’s no stopping the selling wave. Forget about any quick rebounds; they’ll be met with fierce resistance. 😬
Where’s the Bottom? Let’s See…
The Exponential Moving Averages (EMAs) are still playing the sad song of a downtrend. Short-term EMAs are sitting comfortably below long-term EMAs, clearly saying, “Nope, no recovery here.”
If PI keeps sliding, the next line in the sand is $0.66. Drop below that, and we might be looking at a tumble down to $0.57. Hope you packed a parachute. 🪂
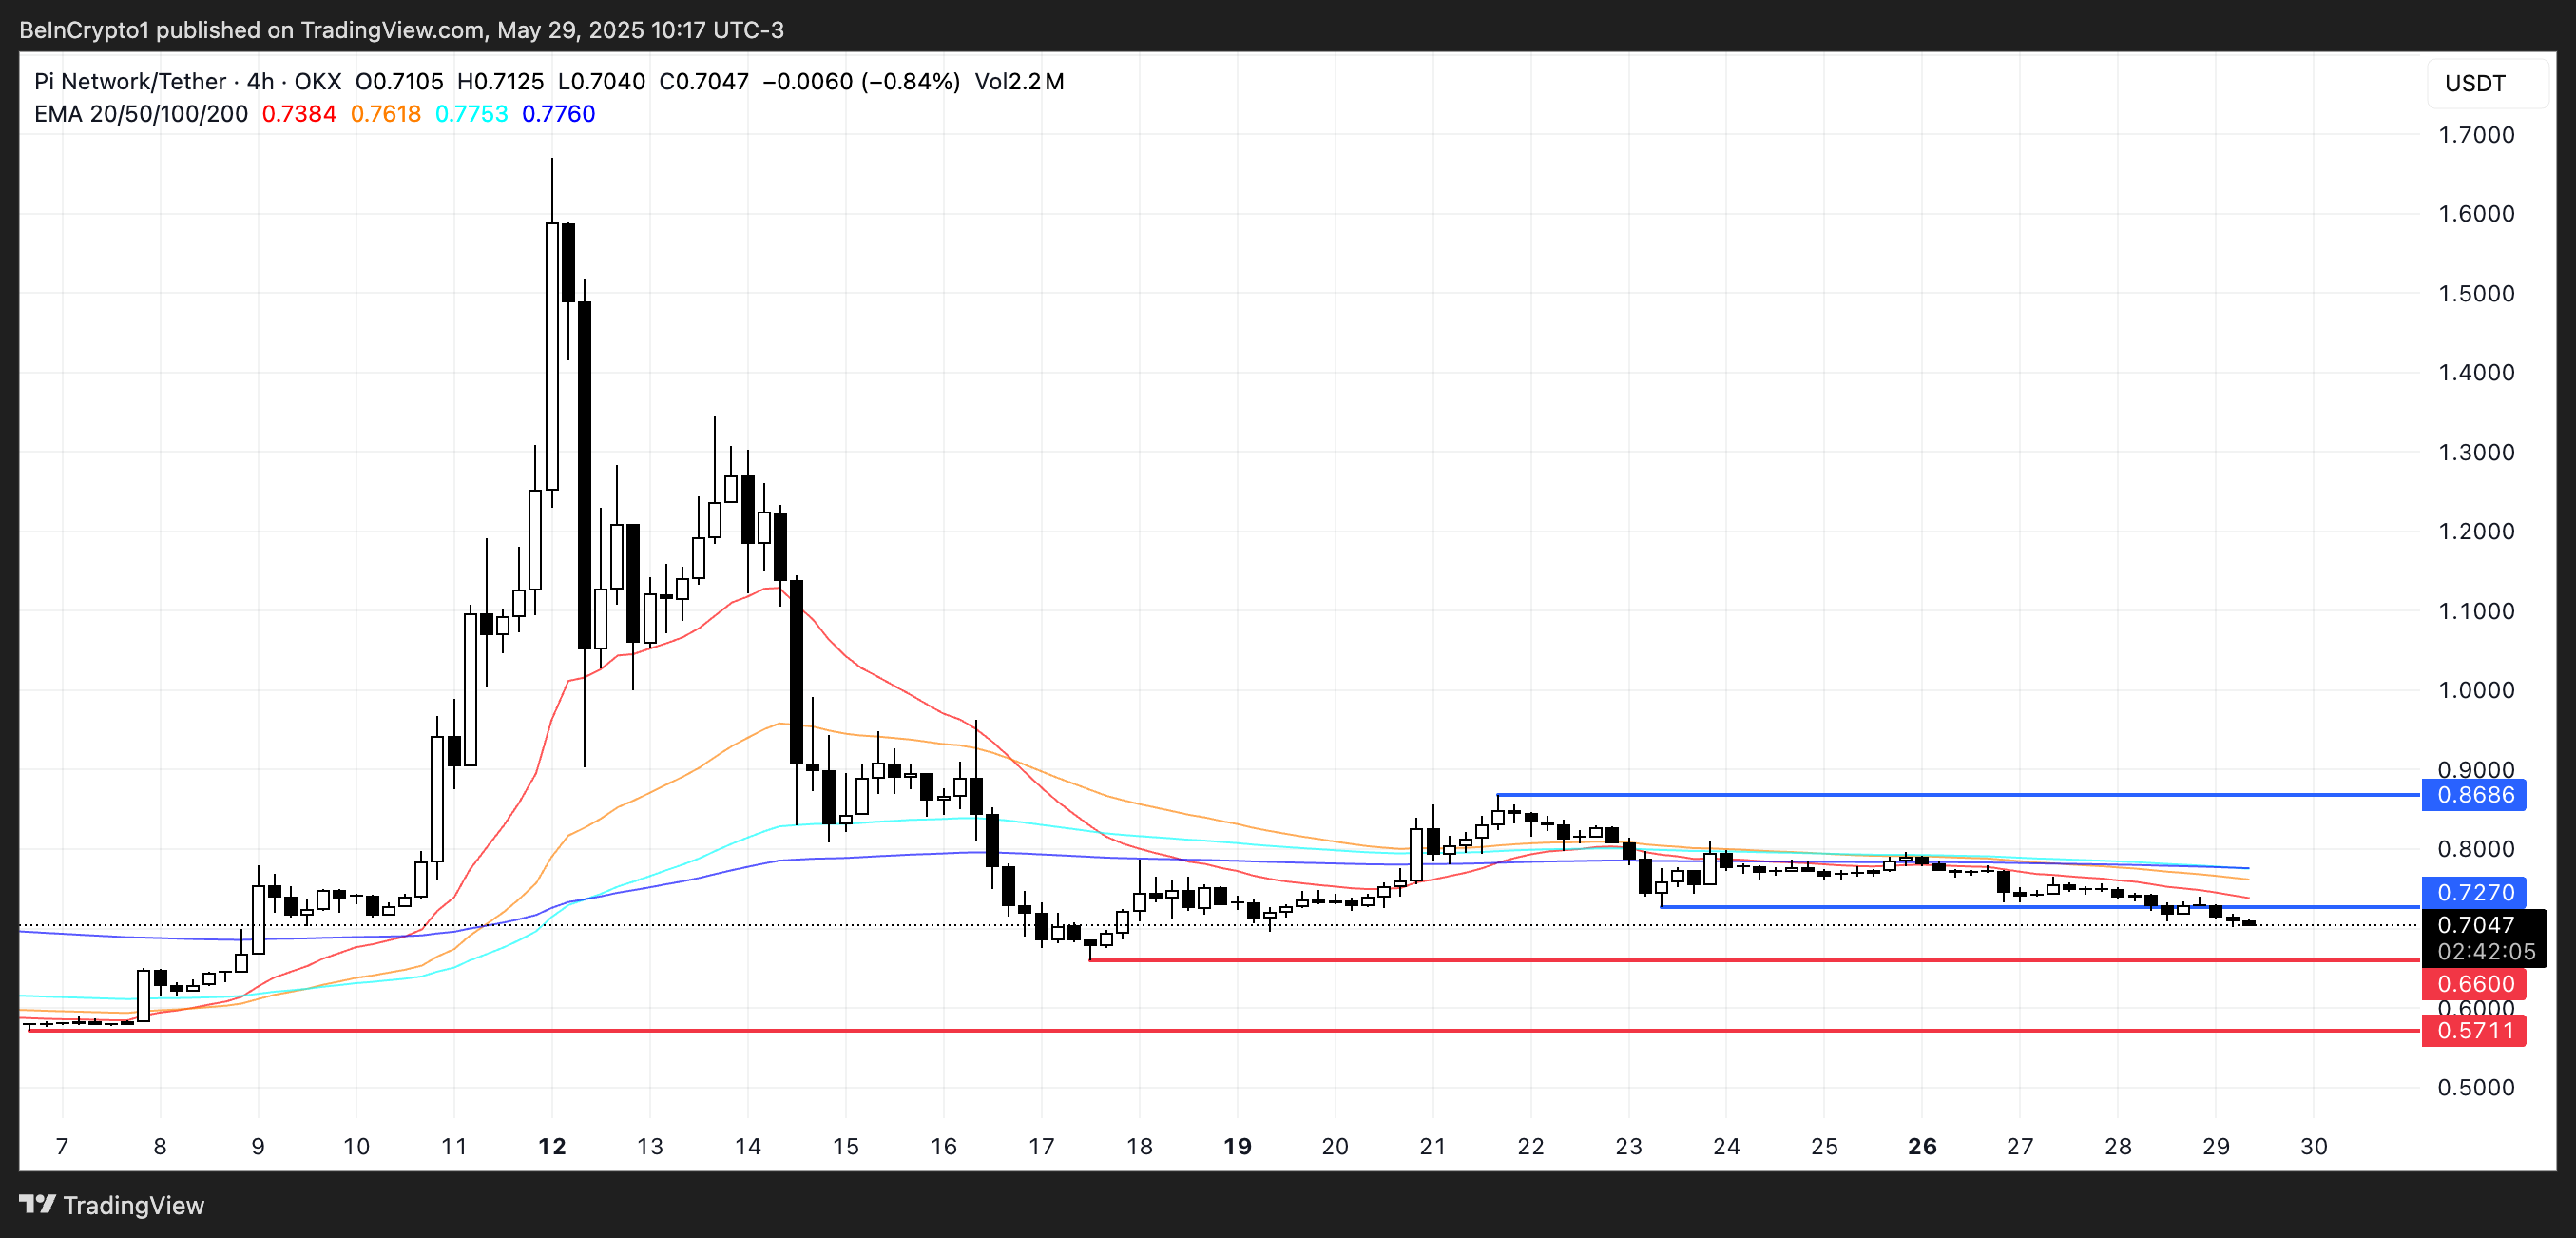
On the rare chance PI pulls a dramatic U-turn, watch out for resistance at $0.727. Break through that, and maybe—just maybe—it’ll climb toward $0.86. But, and this is a big but, until those short-term EMAs start showing some life, any attempts at a rally are probably doomed. 🤞
Read More
- Silver Rate Forecast
- Gold Rate Forecast
- Gods & Demons codes (January 2025)
- Honor of Kings returns for the 2025 Esports World Cup with a whopping $3 million prize pool
- Superman: DCU Movie Has Already Broken 3 Box Office Records
- Grimguard Tactics tier list – Ranking the main classes
- Mech Vs Aliens codes – Currently active promos (June 2025)
- Former SNL Star Reveals Surprising Comeback After 24 Years
- USD CNY PREDICTION
- Kanye “Ye” West Struggles Through Chaotic, Rain-Soaked Shanghai Concert
2025-05-30 01:40