Ah, XRP. Currently dawdling around $2.35. With a market cap that could probably buy a small country ($138.14 billion, give or take), and a daily trading volume of $58.62 billion. You’d think it could make up its mind! Intraday, it bounced between $2.33 and $2.43, showing all the stability of a toddler on a sugar rush. 🤪
XRP
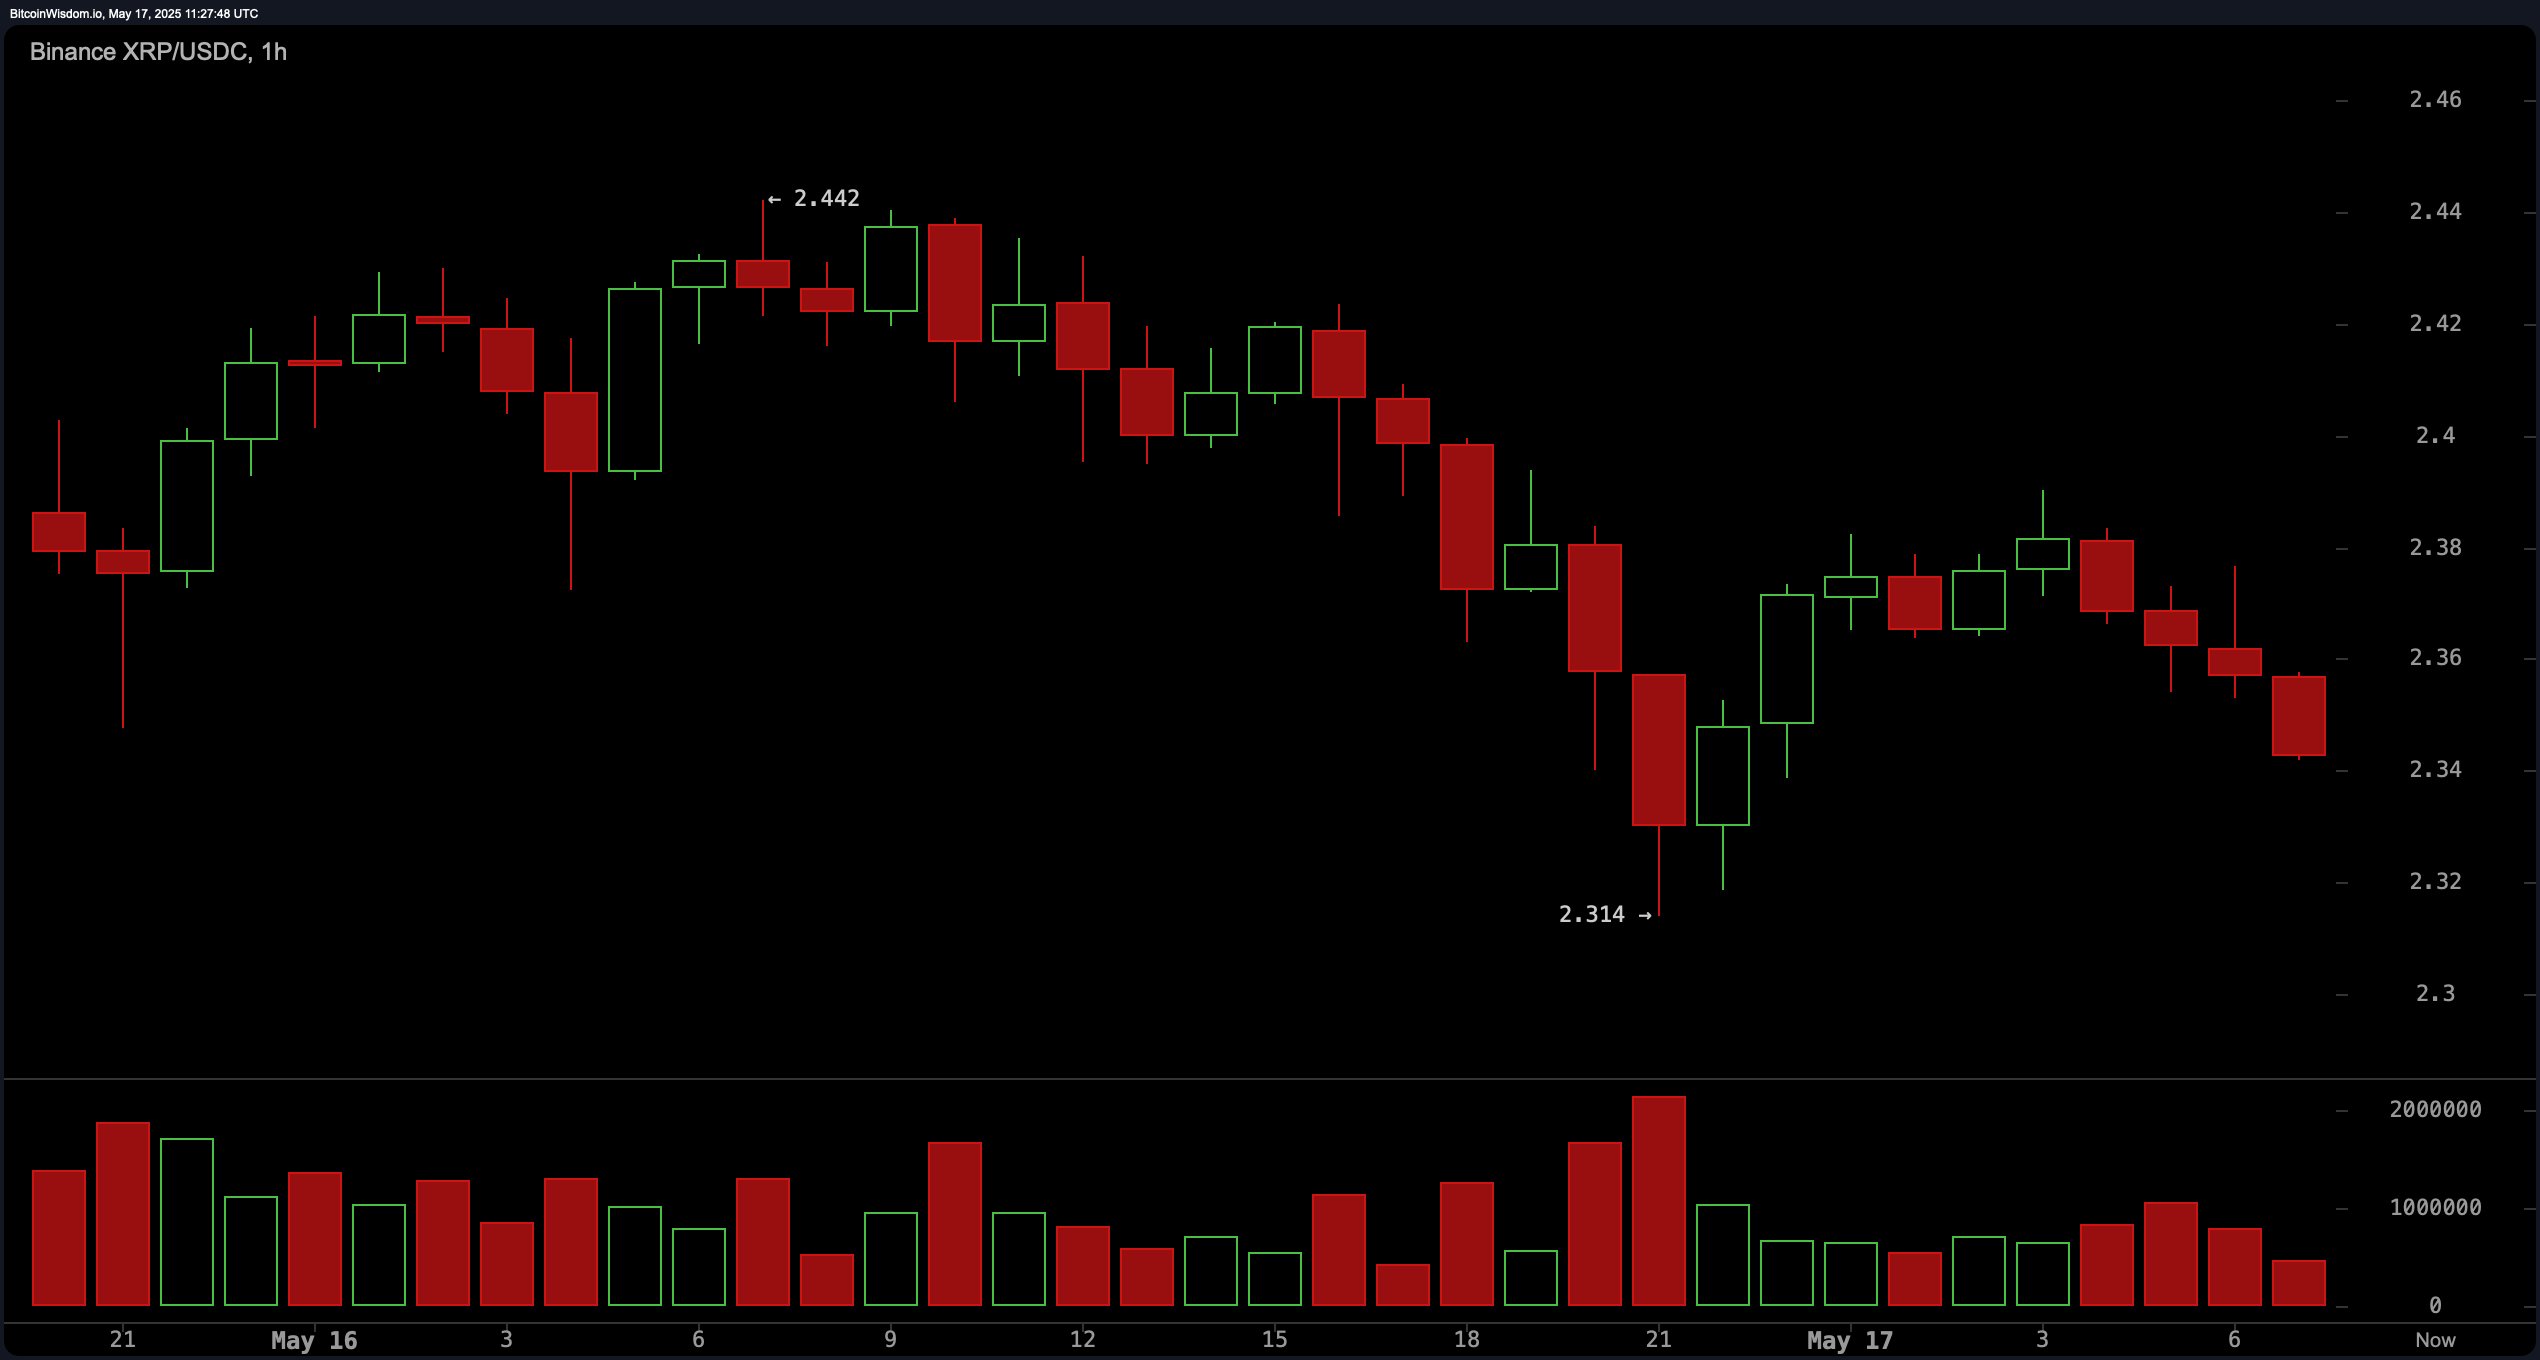
The 1-hour chart? Oh, it’s a mess. A clear pullback, apparently. Lower highs, lower lows – it’s like a depressing dance routine. The $2.31 support level is being tested more often than a new shampoo in a focus group. If it fails, we might see a drop to the $2.20 zone. Volume profile? Red is outweighing green, which, in crypto terms, is roughly equivalent to seeing a flock of pigeons wearing tiny “sell” signs. 🐦

The 4-hour chart isn’t much cheerier. Downtrend below a critical resistance of $2.44. A potential lower high! It’s like watching a slow-motion train wreck. It peaked near $2.656, then decided to embrace its inner couch potato. Large green volume spikes showed initial institutional interest, but the follow-through was weaker than my resolve to avoid cake. If it closes below $2.30, brace yourselves for $2.20. 📉

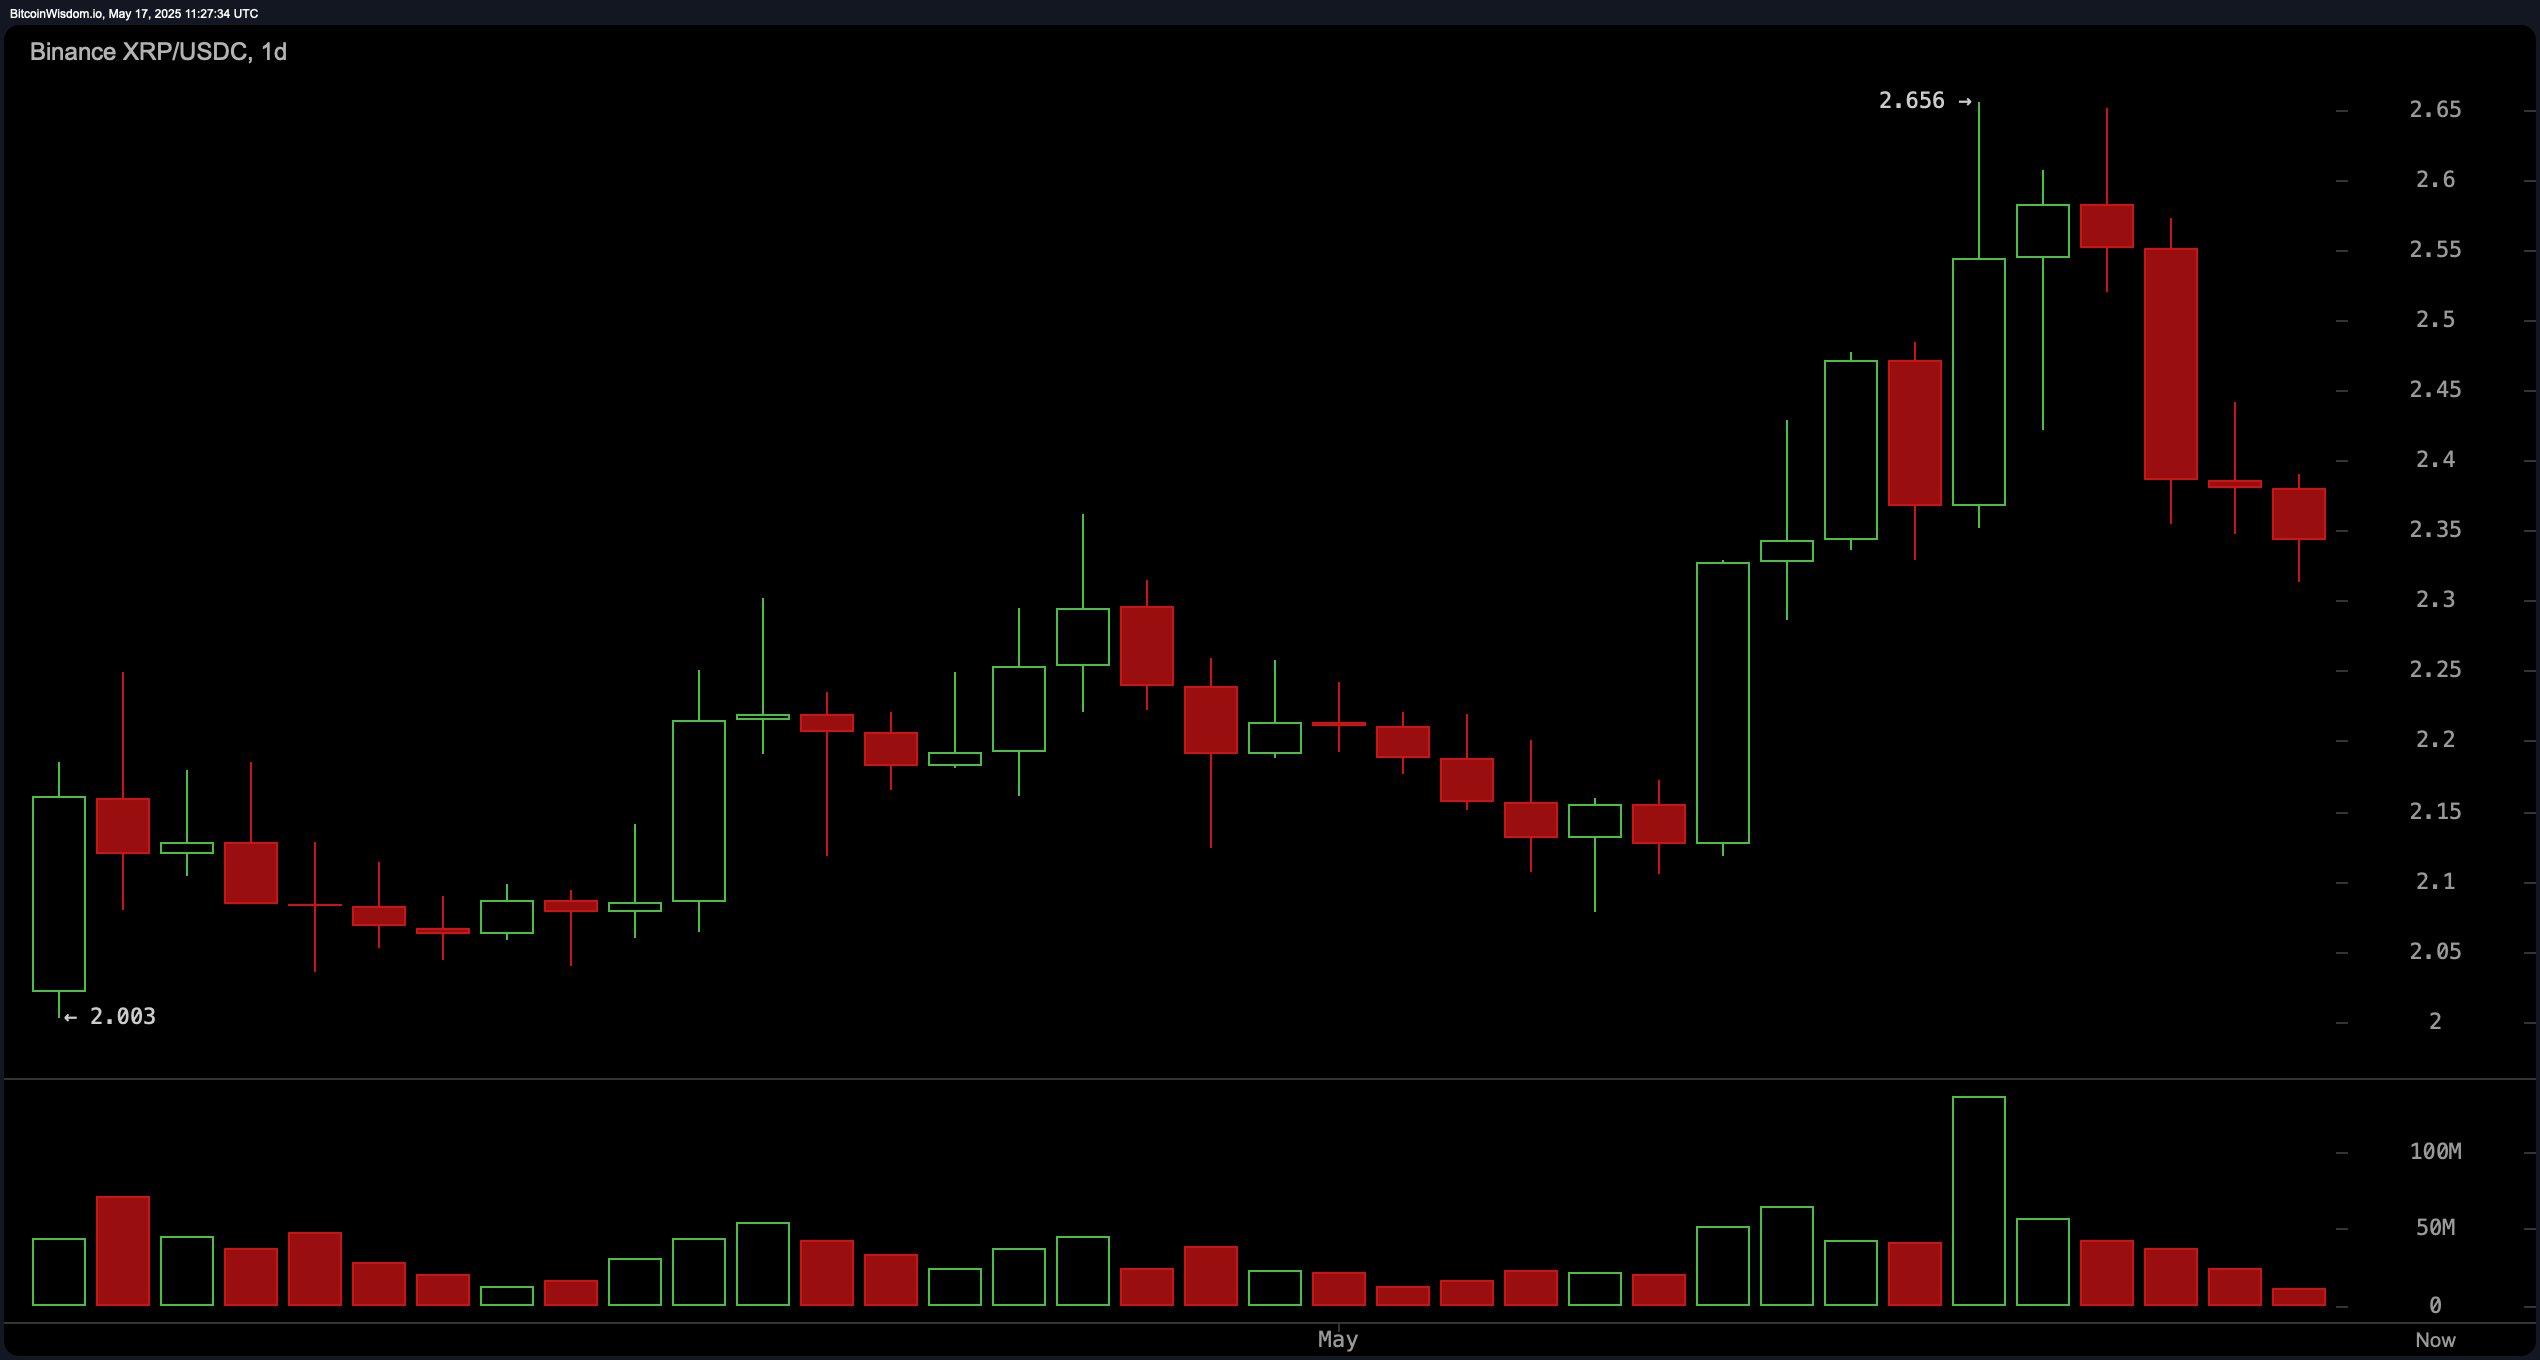
But wait! The daily chart offers a glimmer of hope. Structurally bullish! Higher highs and higher lows! It’s consistent with a weakening uptrend. A daily close above $2.40–$2.45 on significant volume could send it back to $2.60. Key to this, apparently, is holding the $2.30 support. It’s a pivotal area, which in crypto-speak means “prepare for anything.” 🤔

Oscillators are neutral. RSI at 52.73389, Stochastic at 50.66967, CCI at 22.90536. It’s like they’re all sitting on the fence, sipping tea and watching the chaos unfold. ADX at 20.27480 suggests a weak trend. Awesome oscillator at 0.22143. Momentum is negative, while MACD at 0.07107 presents a bullish signal. So, basically, nobody knows what’s going on. 🤷
Moving averages (MAs) are mixed. The 10-period EMA and SMA show sell signals, while everything else from the 20-period to the 200-period screams “buy!” Short-term pressure, but the broader trend remains positive. The 200-period EMA at $2.03875 and SMA at $2.17692 are very supportive of the longer-term bullish bias. Translation: it might go up, it might go down. 🤷♂️
Bull Verdict:
XRP remains structurally bullish. If it holds $2.30 and reclaims $2.40–$2.45 on rising volume, it could resume its uptrend toward $2.60 and beyond! Longer-term bullish momentum will be reinforced! Huzzah! 🎉
Bear Verdict:
Despite the broader uptrend, short-term charts show weakness. Failure to defend $2.30 could trigger a deeper retracement toward $2.20 or even $2.10! Bearish short-term scenario confirmed! Fading momentum and growing sell volume! Oh dear! 😱
Read More
- 10 Most Anticipated Anime of 2025
- Silver Rate Forecast
- Pi Network (PI) Price Prediction for 2025
- USD MXN PREDICTION
- USD CNY PREDICTION
- Brent Oil Forecast
- How to Watch 2025 NBA Draft Live Online Without Cable
- Gold Rate Forecast
- USD JPY PREDICTION
- PUBG Mobile heads back to Riyadh for EWC 2025
2025-05-17 16:32