Bitcoin, the ever-volatile, ever-charming beast of the cryptocurrency world, has decided to settle in the $102,563 to $104,133 range over the past two hours on this fine Monday. With a market capitalization reaching a whopping $2.06 trillion and a trading volume of $34.74 billion, one might assume the digital currency is in the midst of a quiet, uneventful slumber. But beware—beneath this calm surface lies a battle between bulls and bears, with the price gently flirting with resistance near the elusive $105,700 mark. The tension is palpable, my friends.
Bitcoin
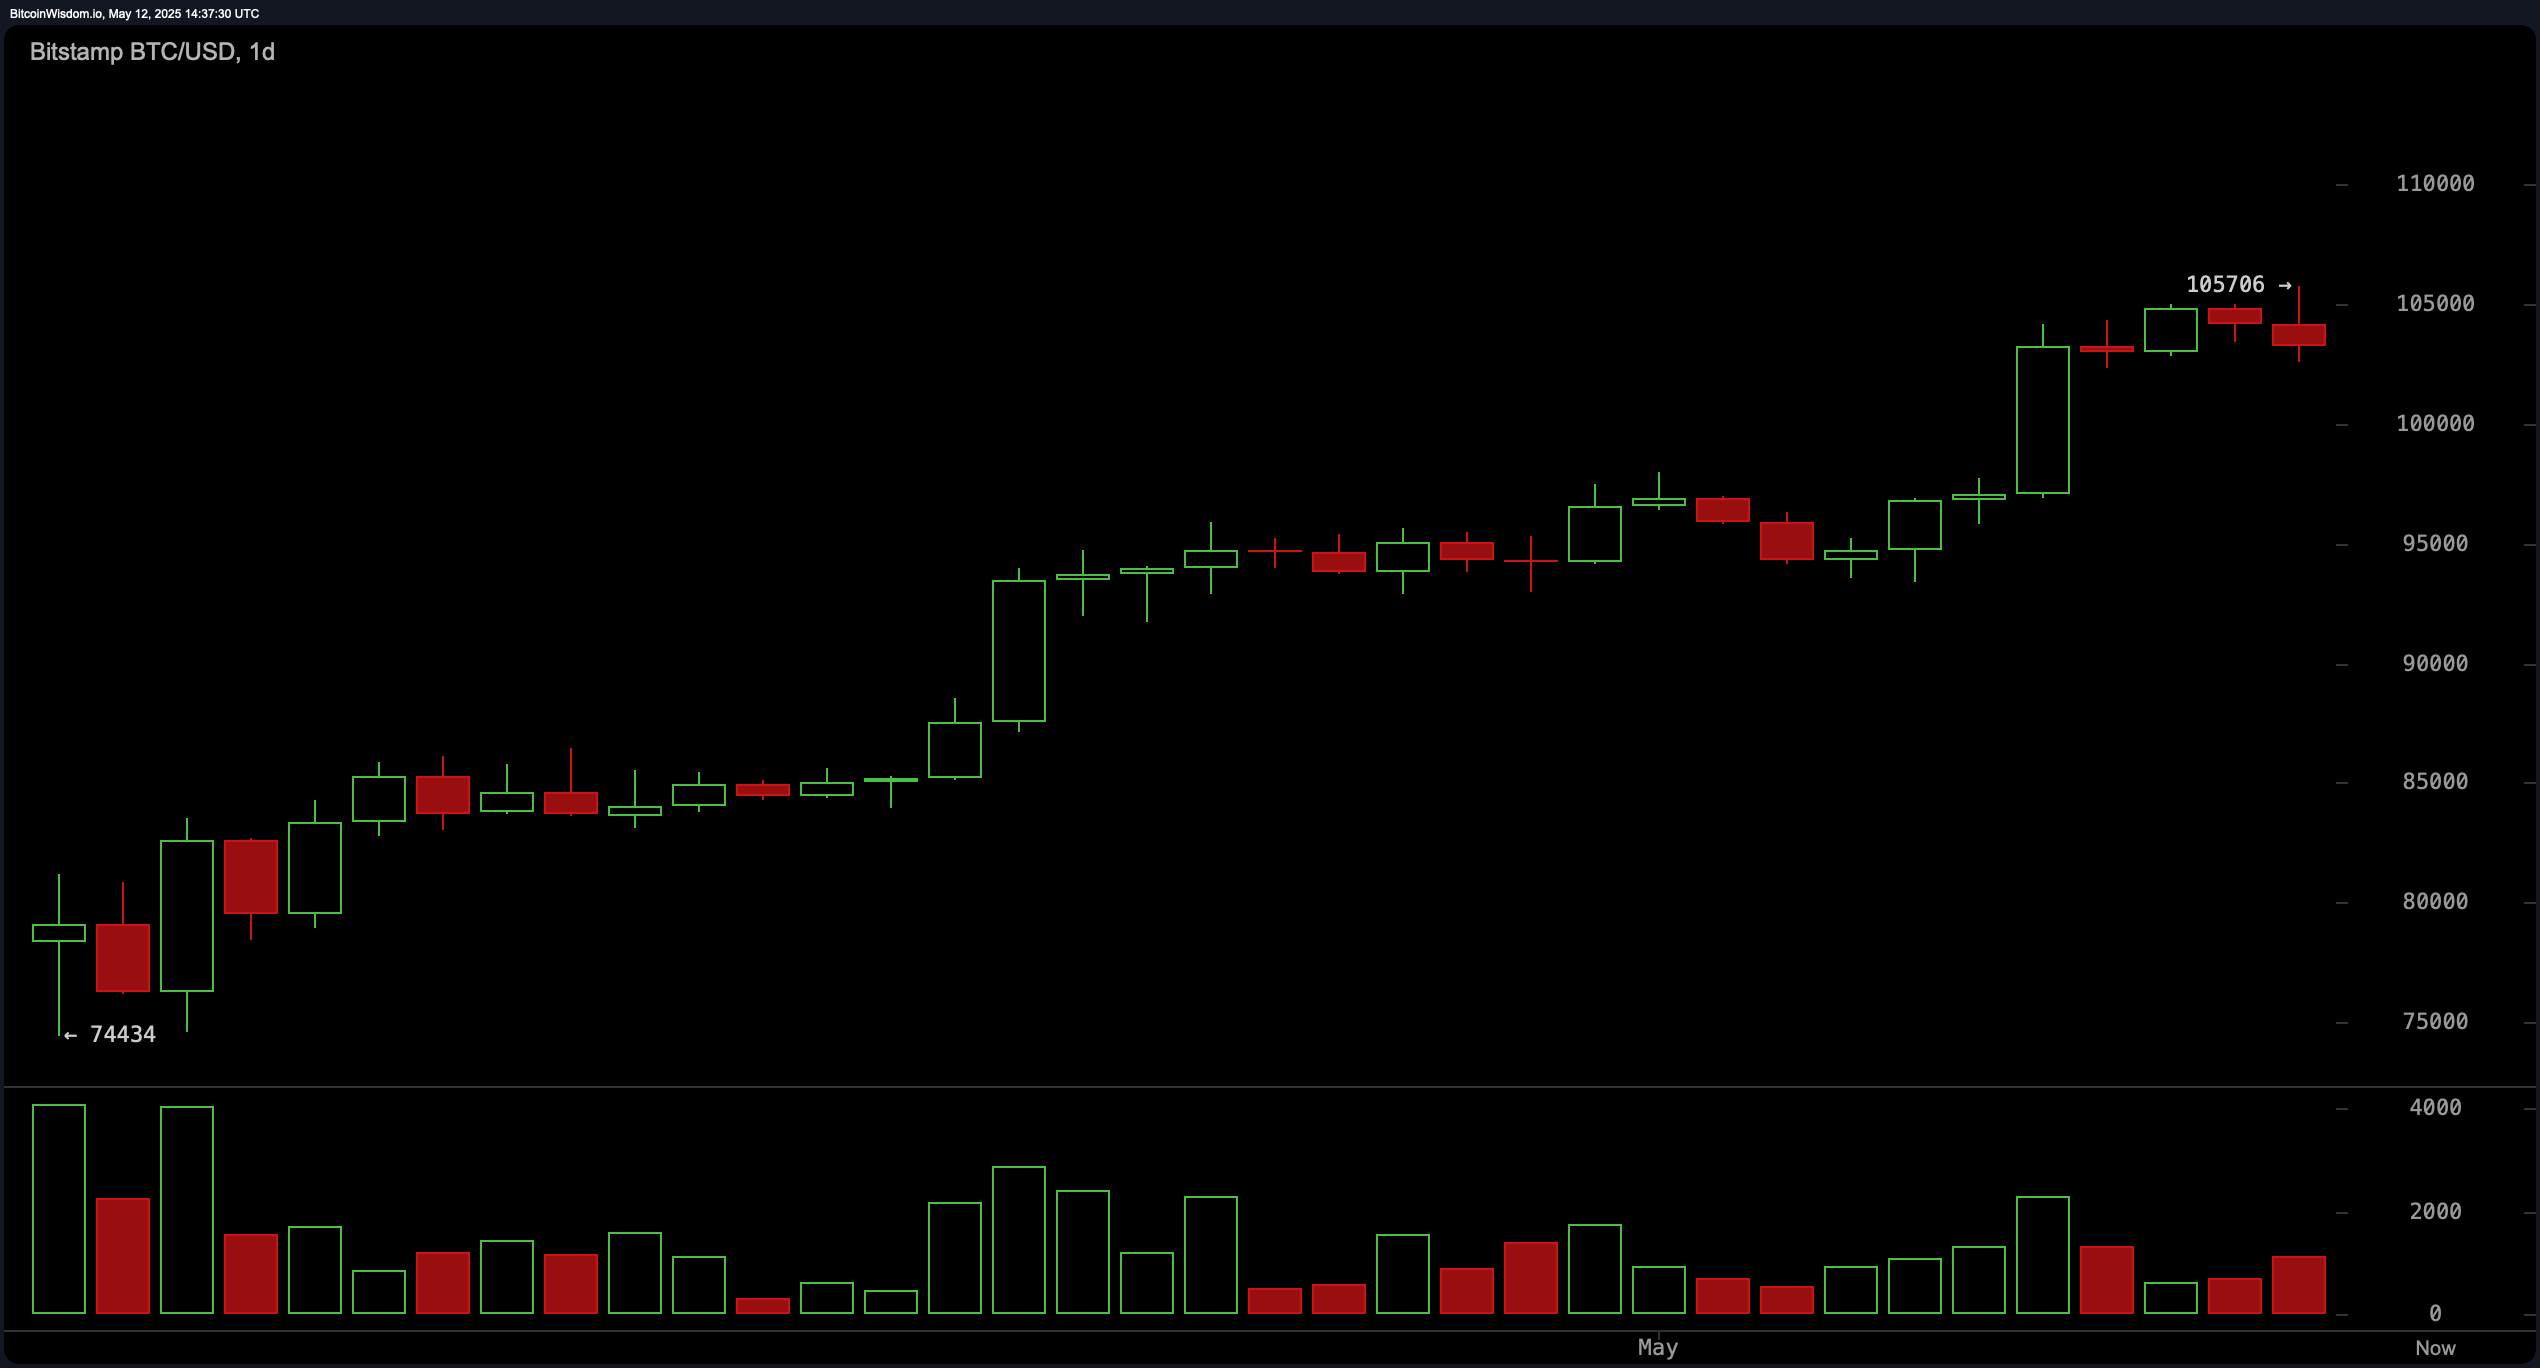
Gaze upon the daily chart, and you will witness a majestic ascent. After breaking past the $74,000 threshold, Bitcoin has maintained a steady rhythm of higher highs and higher lows. Yet, like a hero facing a formidable foe, it has encountered resistance around the $105,700 level. Could it be that this is the point of no return? A slight dip in volume whispers that a distribution phase might be upon us. But fear not, the mighty moving averages (EMA and SMA) from 10 to 200 periods continue to wave their flags of support, declaring buy signals at every turn. Still, the oscillators are a bit of a mixed bag—while the MACD remains bullish with a reading of 4,184, other indicators like the momentum and CCI are flashing warning signs, hinting at an underlying divergence.
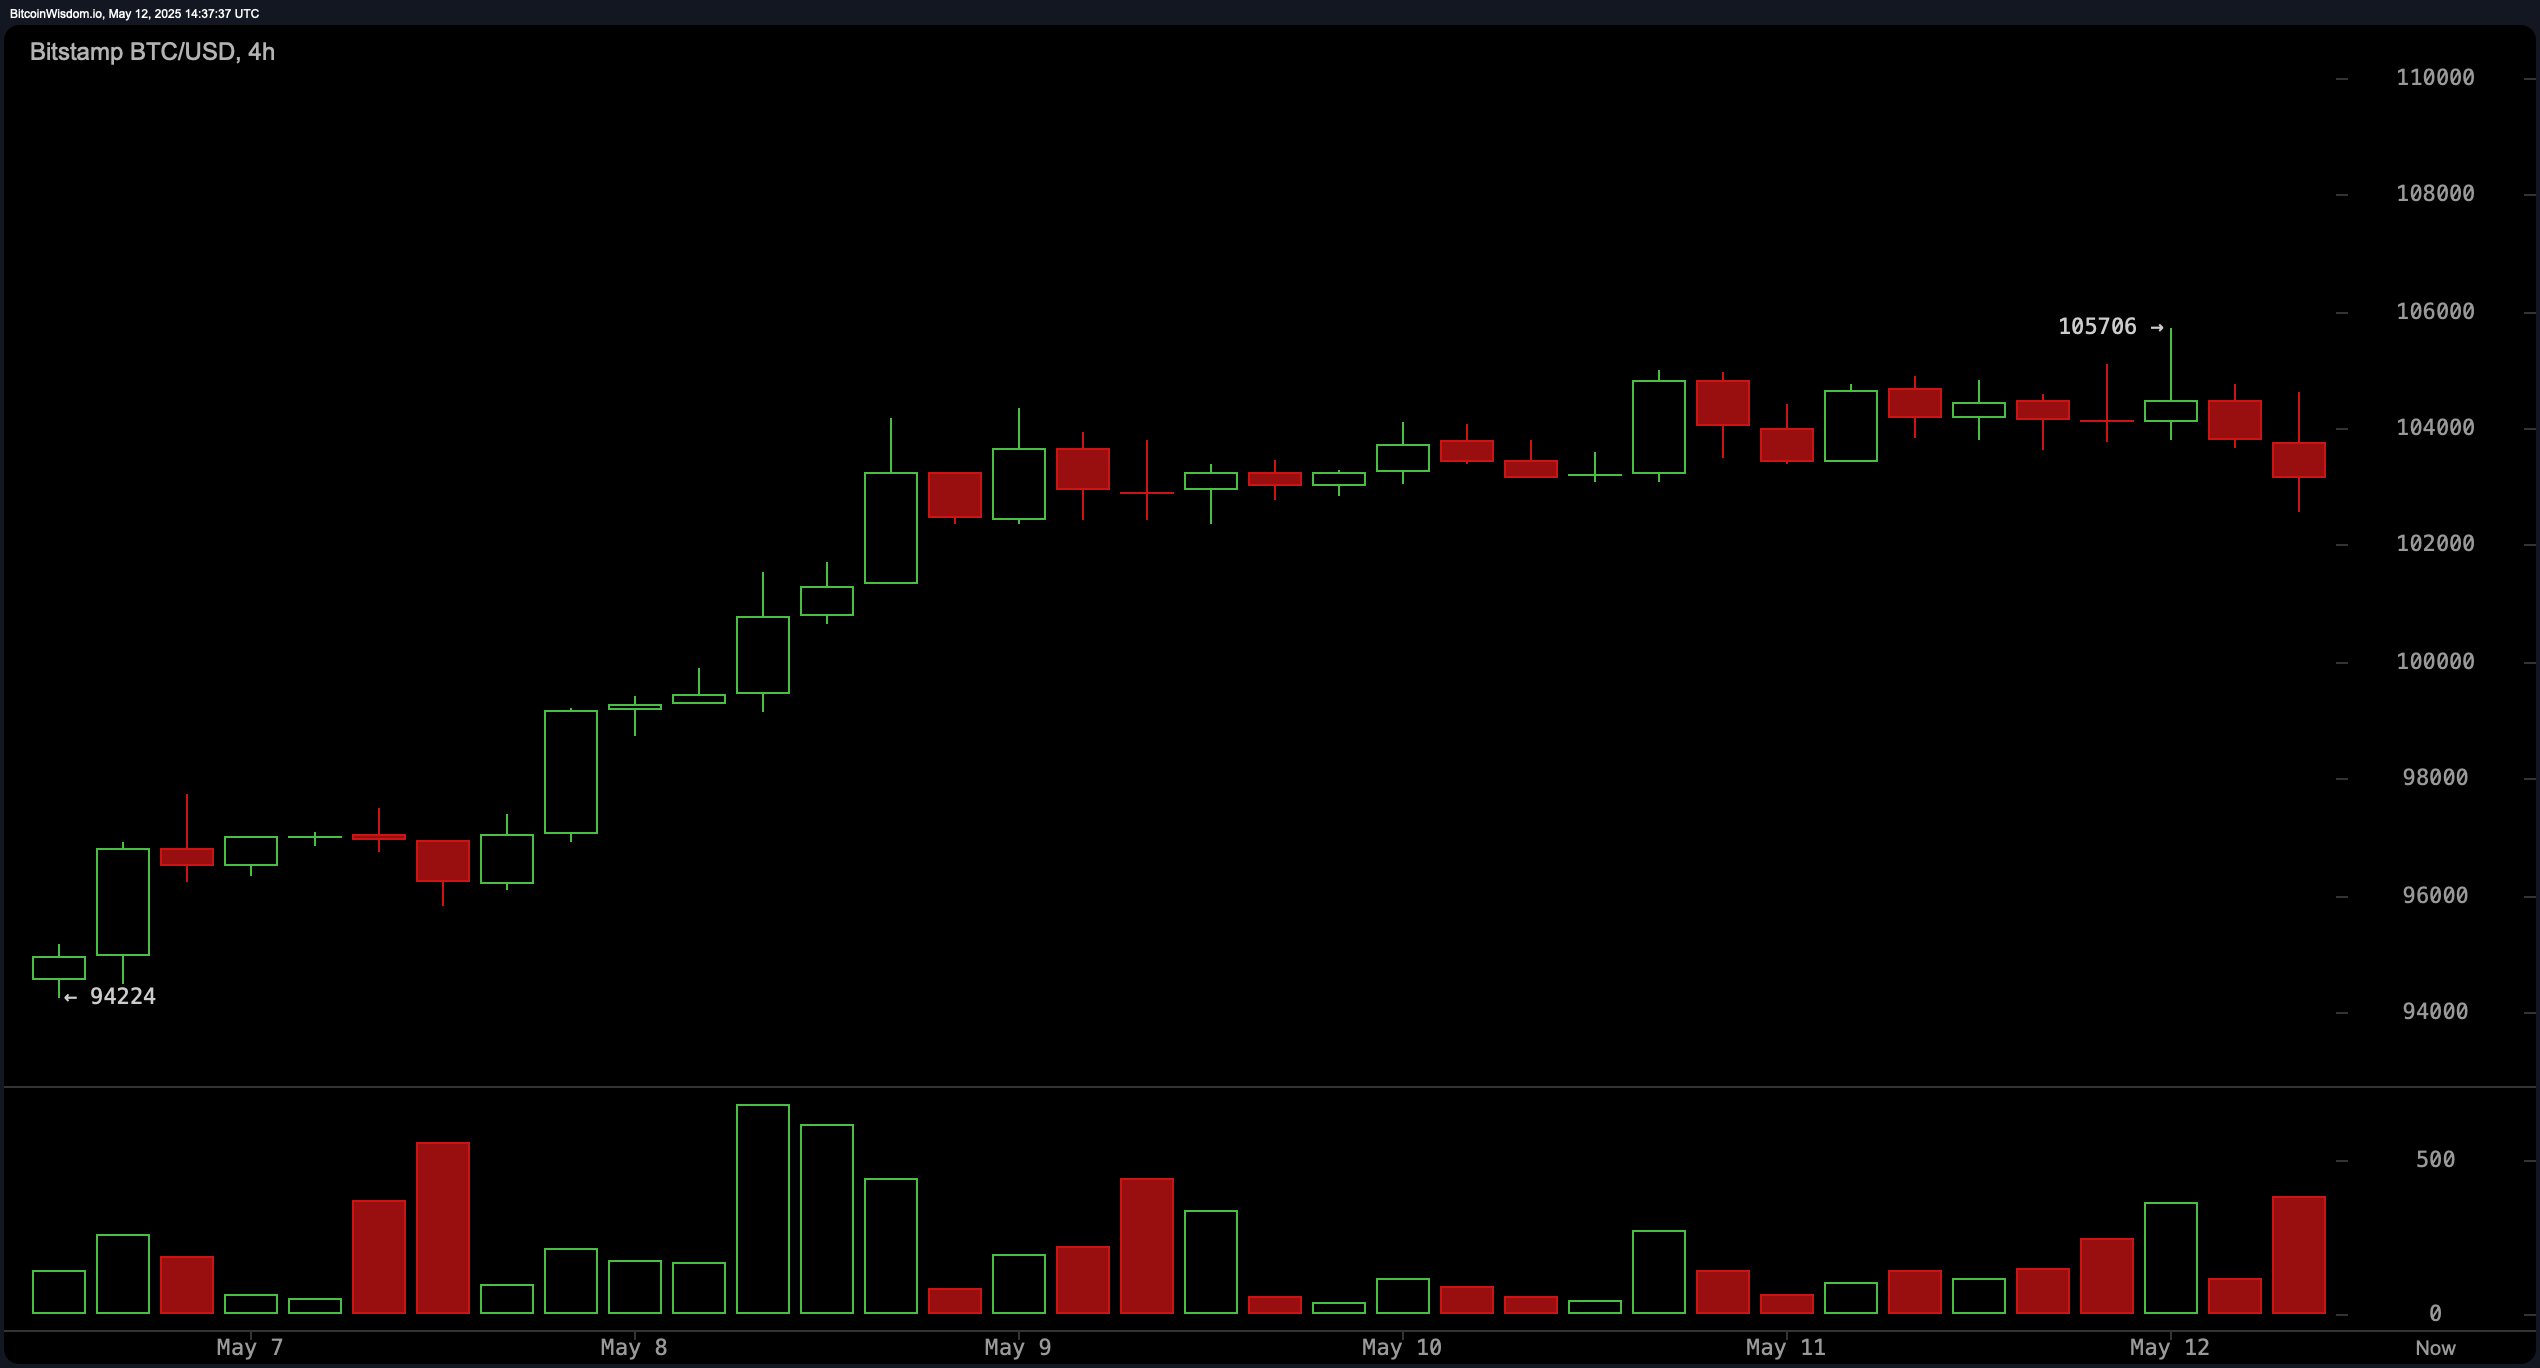
On the 4-hour chart, Bitcoin has experienced a rally from $94,000, but now, alas, it is stuck beneath the resistance at $105,700. This rather boring range-bound behavior suggests a possible fading of bullish momentum—oh, the humanity! Several failed attempts to break the ceiling may signal the formation of a double-top pattern, which is a classic tale of price hesitation. The moving averages still suggest an upward trend, but the oscillators, particularly the CCI and momentum, are showing signs of caution. A breakout above $105,700, with robust volume, would be the stuff of legends. On the flip side, a dip below $103,000 might just bring the whole bullish narrative crashing down.
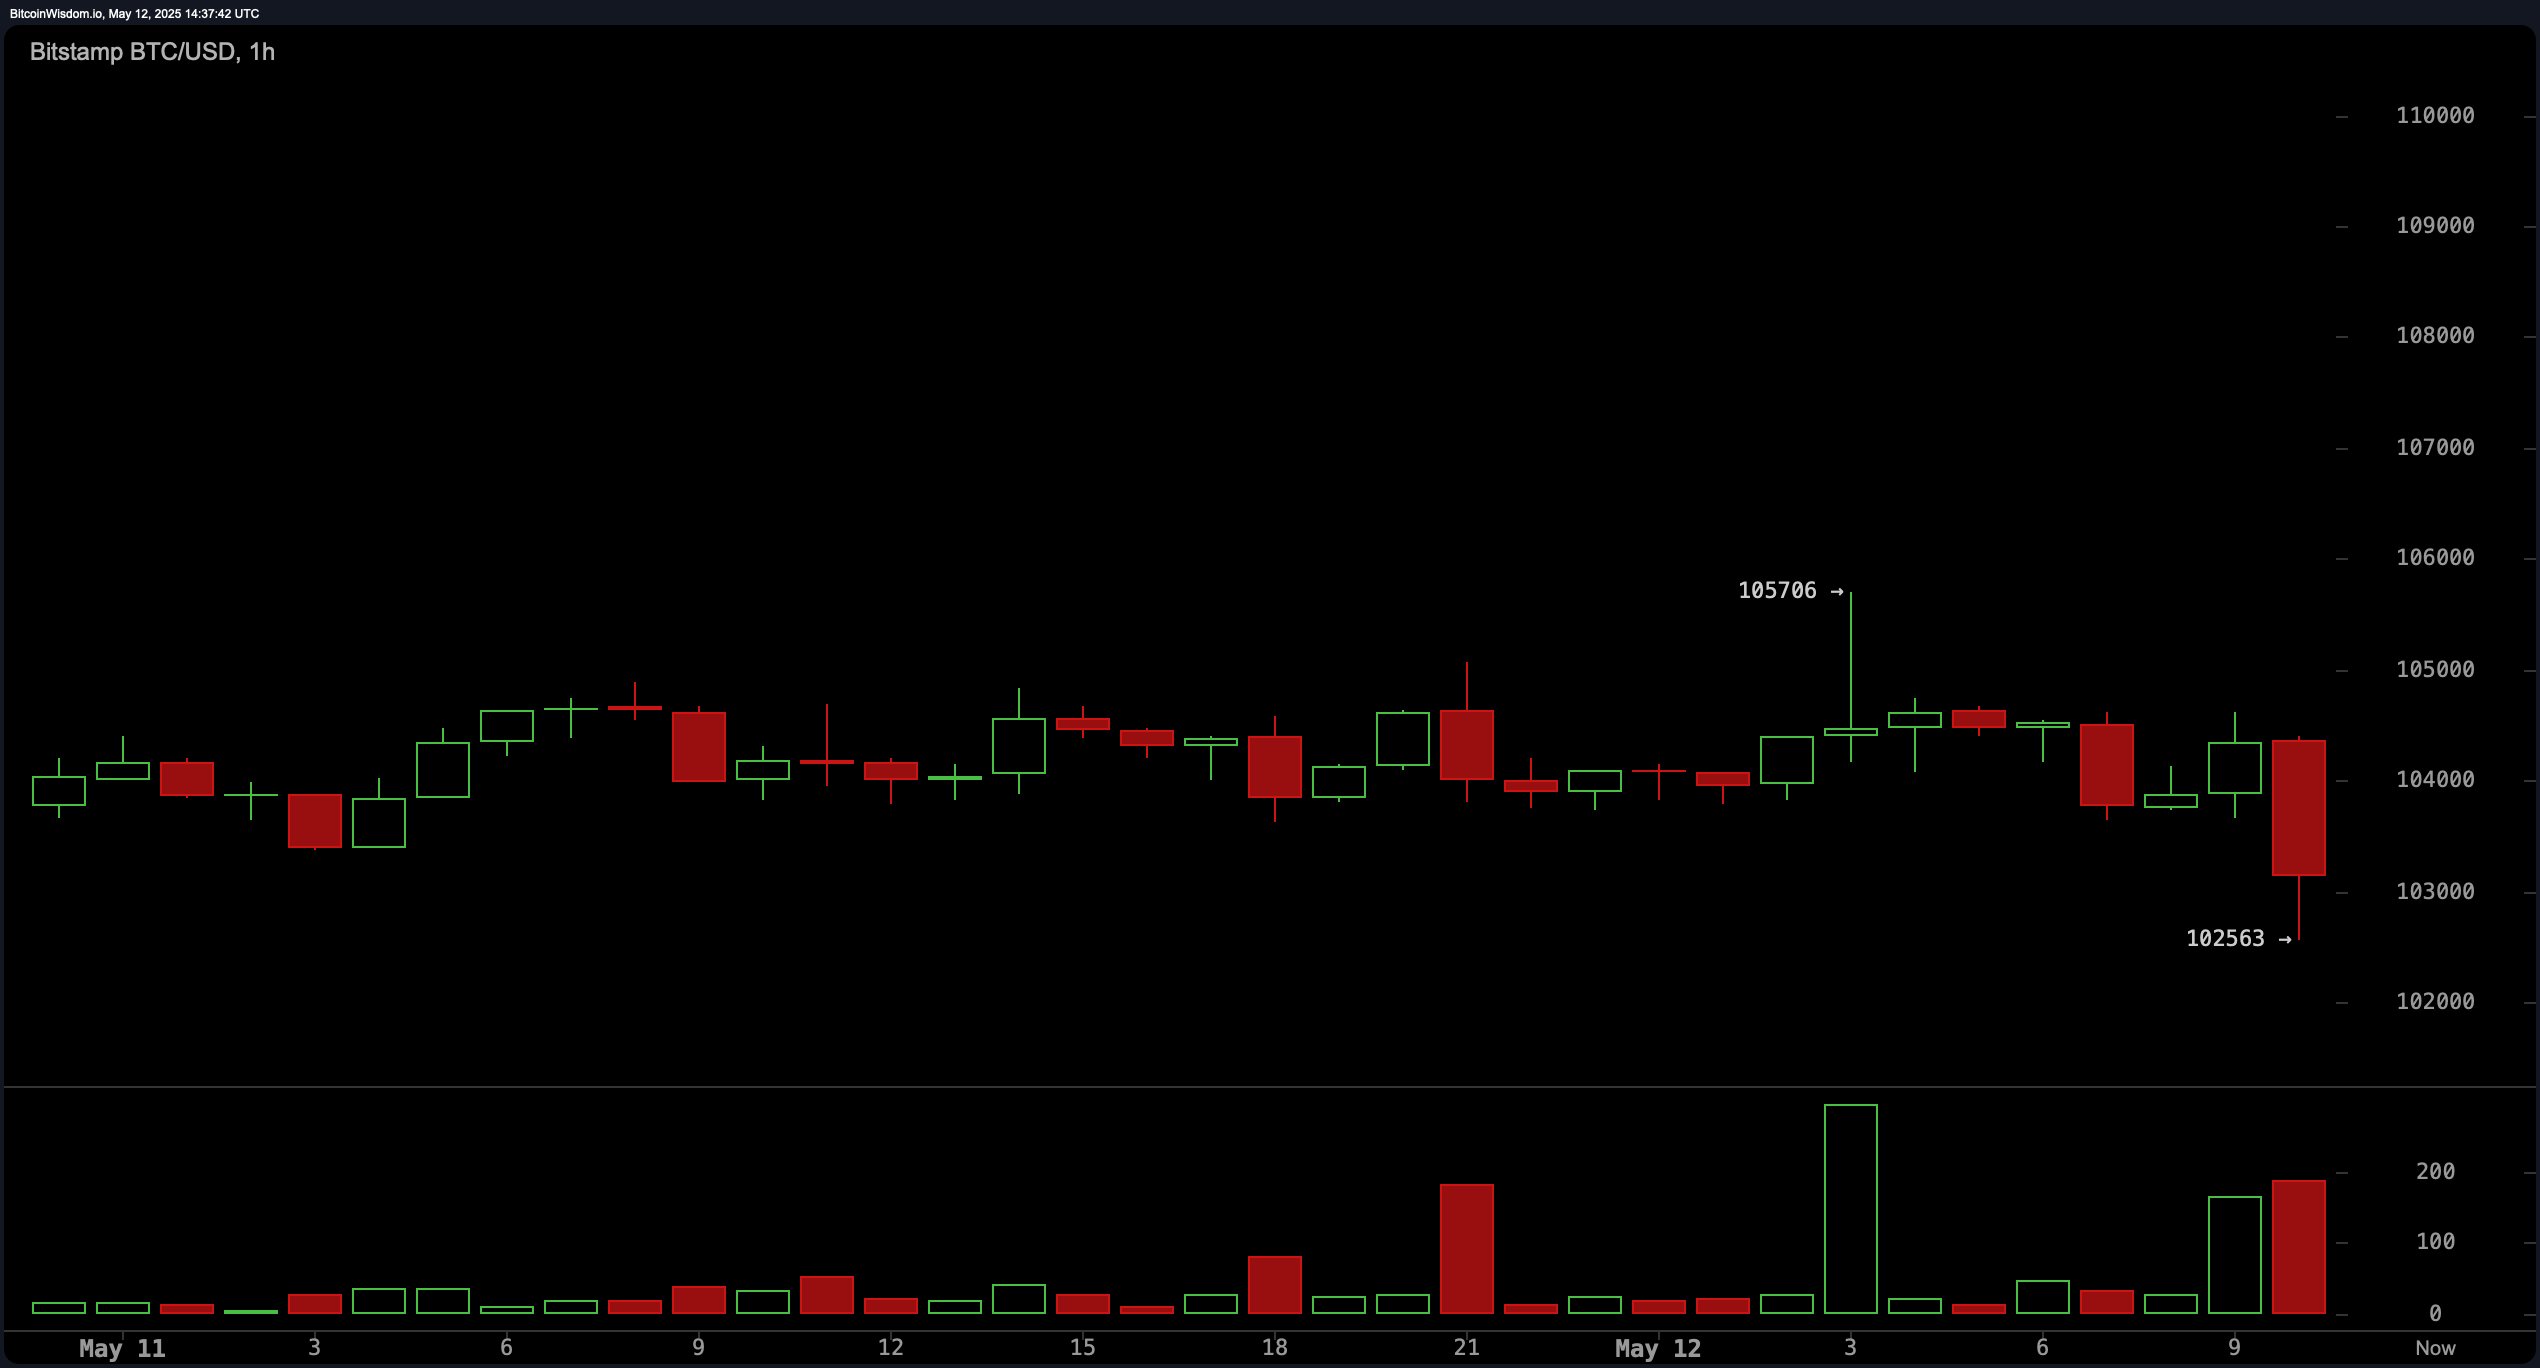
Ah, but what of the 1-hour chart? Here, the drama unfolds with tighter consolidation between $103,300 and $105,700, as indecision reigns supreme. A brief surge to $105,700 was quickly undone, making us all wonder if we’ve been ensnared in a classic bull trap. The volume, oh dear, it has declined since the spike—typically a harbinger of exhaustion. The oscillators are in disagreement, leaving us with an uncomfortable sense of uncertainty: the RSI and stochastic are neutral, while momentum indicates a distinct air of negativity.
The oscillator panel presents a tale of conflicting signals. The RSI is hanging out in neutral territory at 75, while the stochastic is a touch more enthusiastic at 94. But then, we encounter the CCI at 155 and momentum at 7,368—both of which are sending out red flags. The MACD, however, continues to wave its little “buy” banner. A divergence of this magnitude is enough to make any trader break into a cold sweat. It’s as though the bulls are still in charge, but they may be losing steam.
Looking across the vast landscape of moving averages (MAs), one can’t help but notice the overwhelming bullish sentiment. All the key EMAs and SMAs from 10 to 200 periods are signaling buy, as though the very forces of nature are aligning in Bitcoin’s favor. The price is well-supported above the 10-period EMA at $100,813 and the 10-period SMA at $99,834, while the long-term EMAs and SMAs provide a sturdy foundation, suggesting that Bitcoin’s future is as solid as a rock. But beware—should price and volume begin to diverge, we may find ourselves in the midst of a correction that could send us tumbling back toward the $98,000–$100,000 support zone.
Bull Verdict:
Despite the ominous signs of resistance at $105,700, Bitcoin’s price remains steadfast above all major moving averages, and the broader uptrend remains intact. A breakout above this critical level, fueled by strong volume, could send Bitcoin soaring to new heights, perhaps even beyond our wildest expectations. Onward, Bitcoin, to greatness!
Bear Verdict:
However, the bulls’ victory is far from assured. We’ve seen weakening volume, ominous sell signals, and the possibility of a double-top formation on lower timeframes. Should Bitcoin fail to break above $105,700 or dip below $103,000, we might just find ourselves on the wrong side of a short-term correction, with a return to the $98,000–$100,000 support zone looking increasingly likely.
Read More
- Pi Network (PI) Price Prediction for 2025
- USD CNY PREDICTION
- Gold Rate Forecast
- 10 Most Anticipated Anime of 2025
- Silver Rate Forecast
- USD MXN PREDICTION
- EUR CNY PREDICTION
- USD JPY PREDICTION
- Brent Oil Forecast
- Capcom has revealed the full Monster Hunter Wilds version 1.011 update patch notes
2025-05-12 18:39