On Saturday, April 19, 2025, XRP wobbles around a meager $2.08, a mere shadow of its true potential, clinging to a $121 billion market capitalization with a turnover of $1.43 billion over the last 24 hours. Its price action, trapped in an agonizingly narrow range of $2.06 to $2.09, paints a picture of a market that is—dare I say it—almost as indecisive as a bureaucrat at lunch hour. A volatile mood? Hardly. A clear direction? Even less so.
XRP
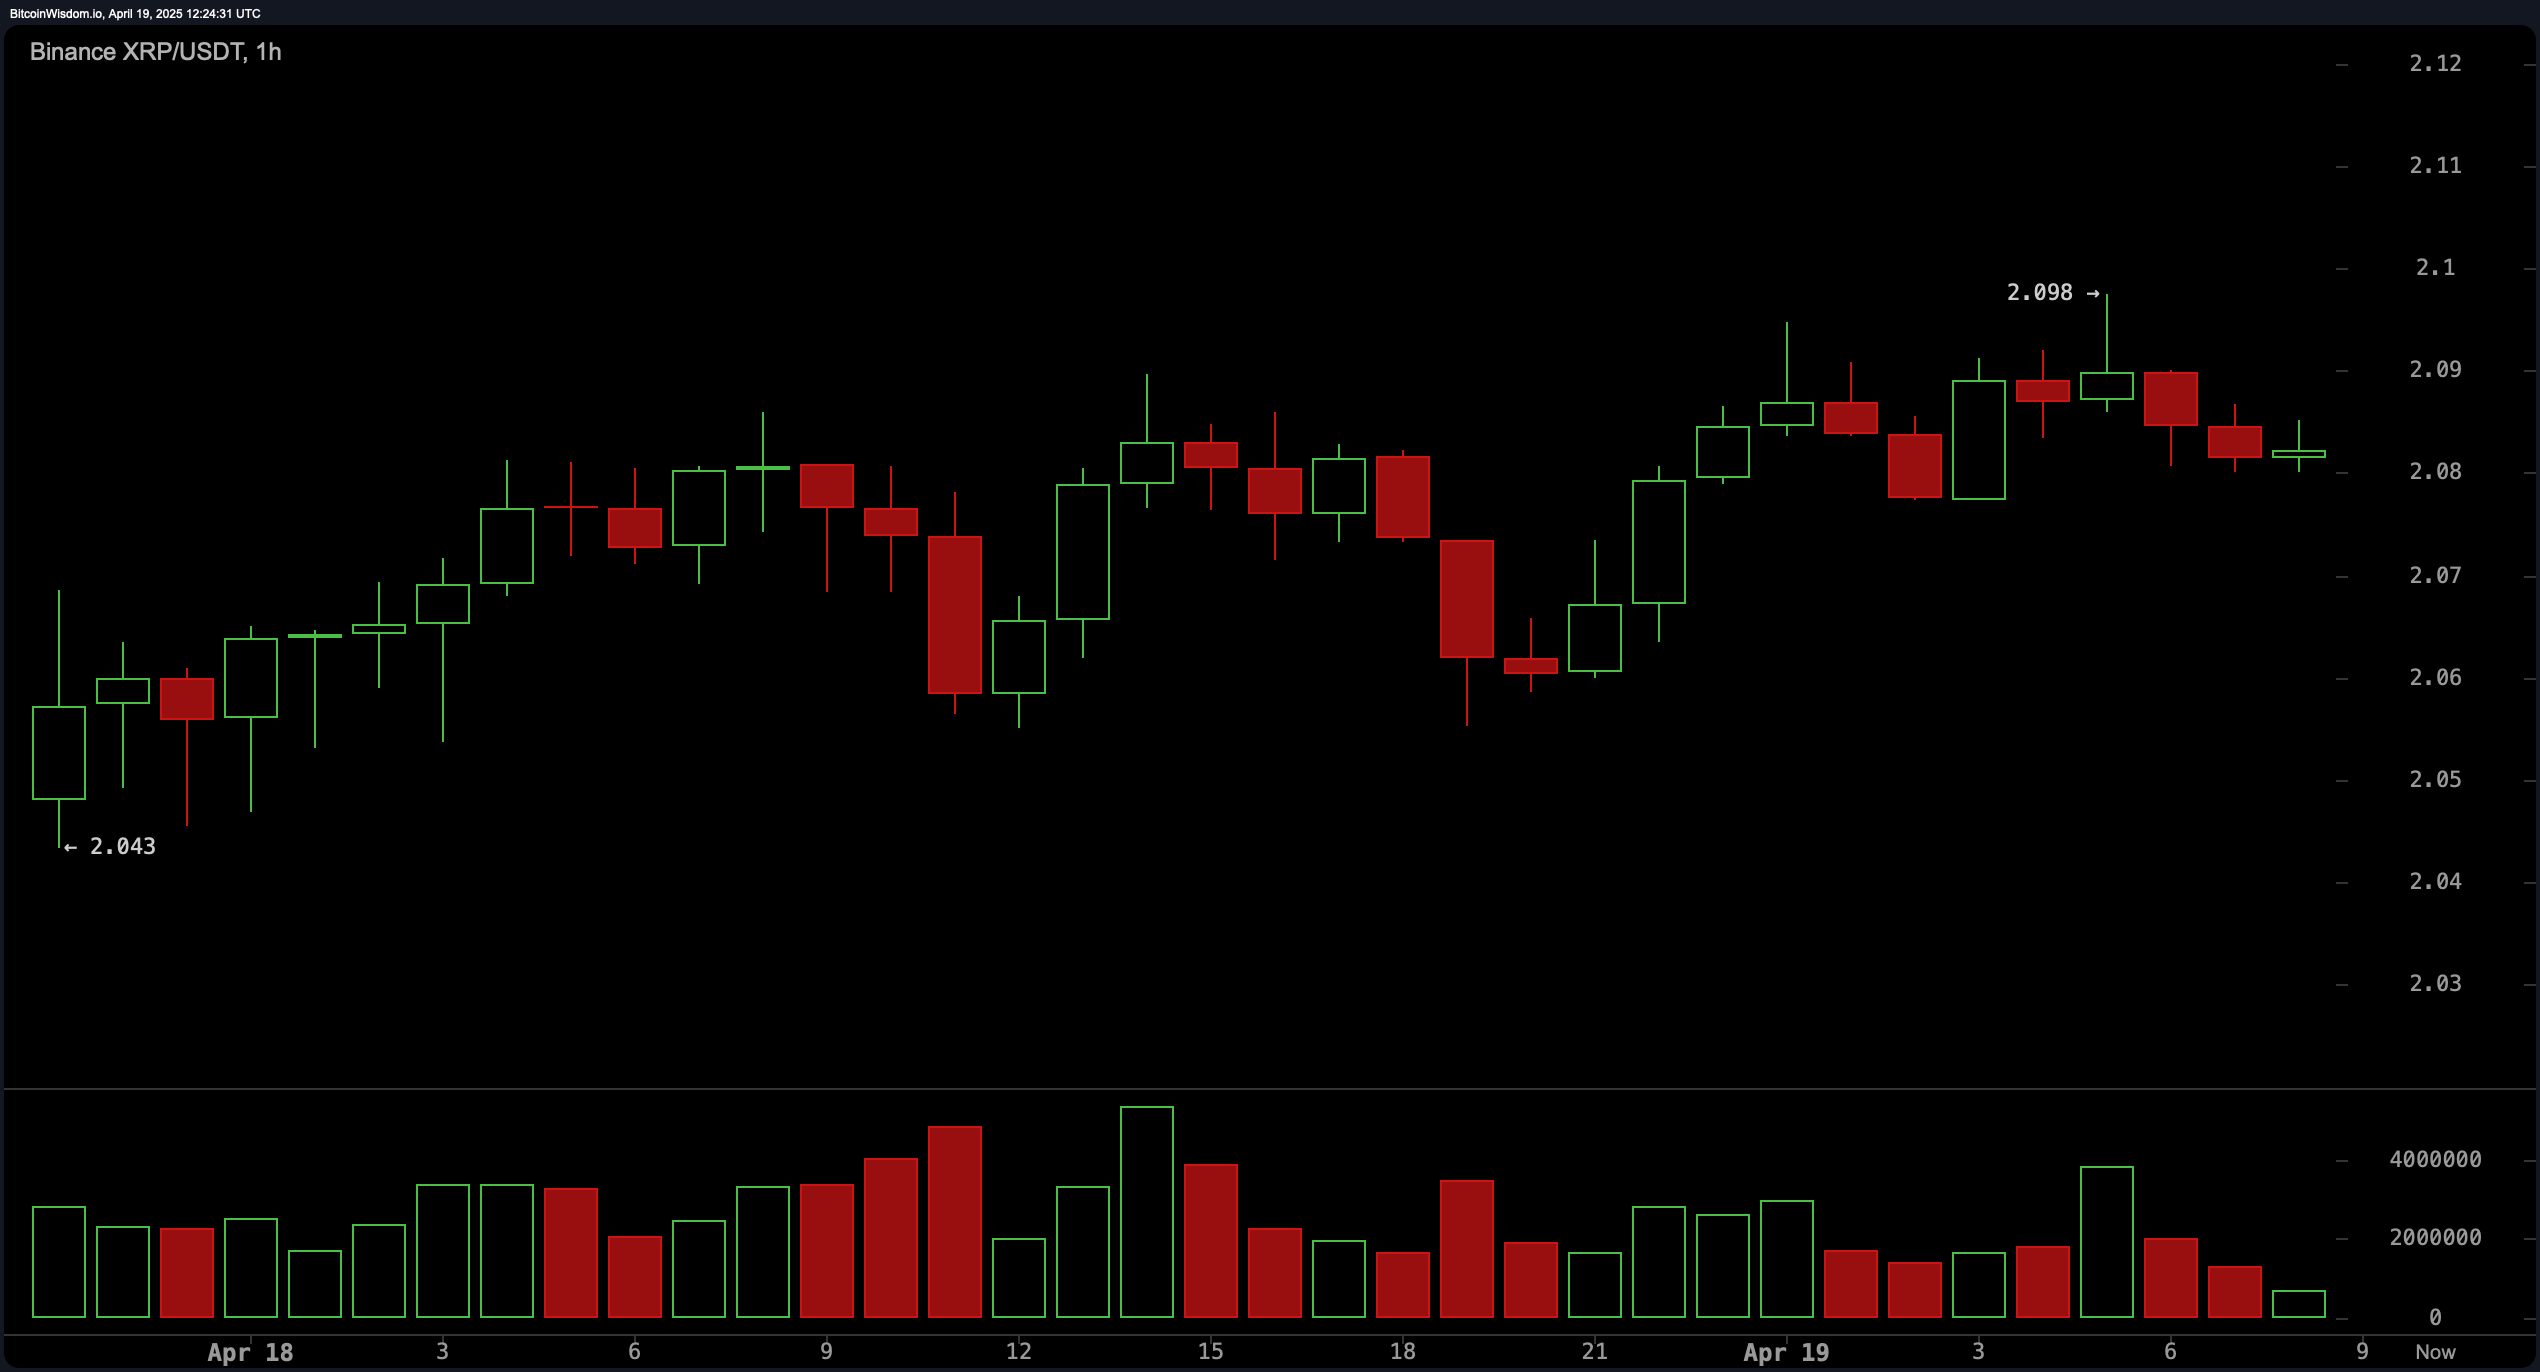
Looking at the 1-hour chart, XRP opened near $2.043, meandered upward like a slow-moving river, hitting $2.098 before retreating back to $2.08. A gentle arc up? Perhaps, though the reality here is a series of lower highs after the peak, marked by a series of red candles—how charming! Volume spiked mid-session, only to plummet like a falling star. Buyer interest? Fading faster than my patience. This market? Utterly indecisive, stuck in limbo, like a man who can’t decide between a midlife crisis or just a nap. So, unless we see a solid bullish confirmation, don’t expect any daring trades to come from this.
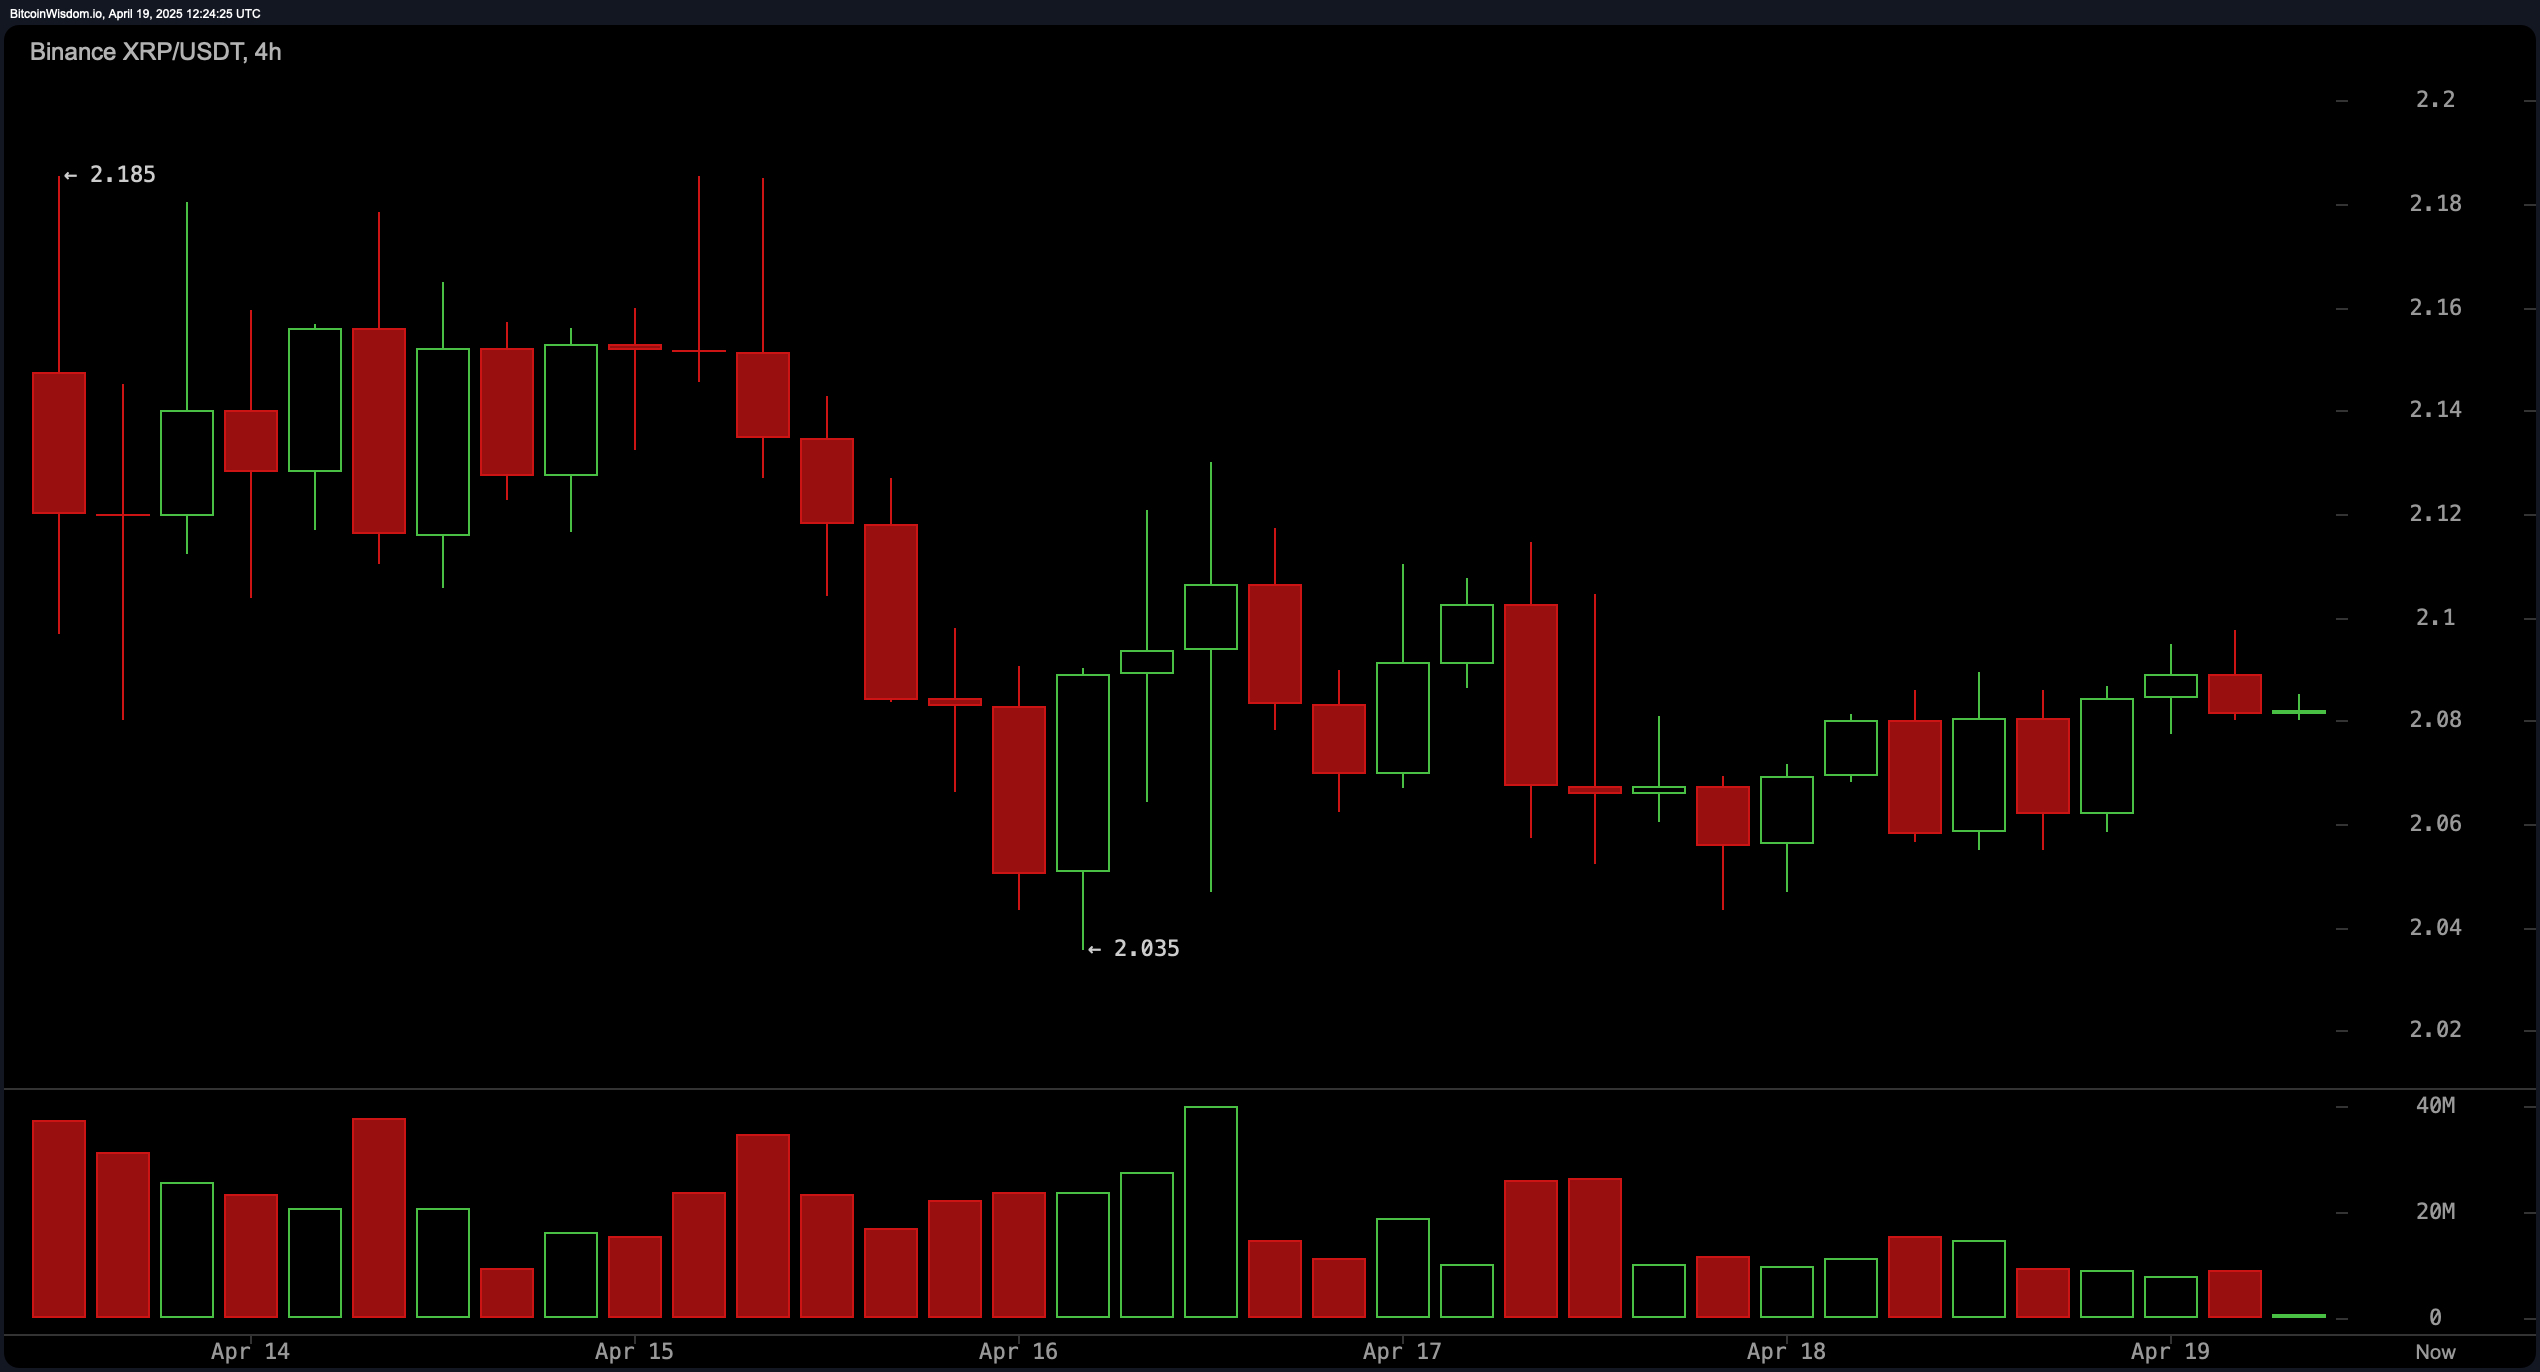
Now, if we step up to the 4-hour chart, here’s what we find: XRP repeatedly smacks its head against $2.10, but the market just won’t let it through. With a local high of $2.185 and support chilling at $2.035, it’s clear that the price is oscillating like a politician at a campaign rally, waving between extremes. The alternating red and green candles look like a tug-of-war between bulls and bears—neither one can manage to pull ahead. Volume is drying up like a river in the desert, and unless a sudden burst of momentum kicks in, this sideways shuffle isn’t going anywhere. What’s the verdict? A neutral stance with just a dash of bearishness—if we don’t break above $2.10, brace yourself for more of this merry-go-round.
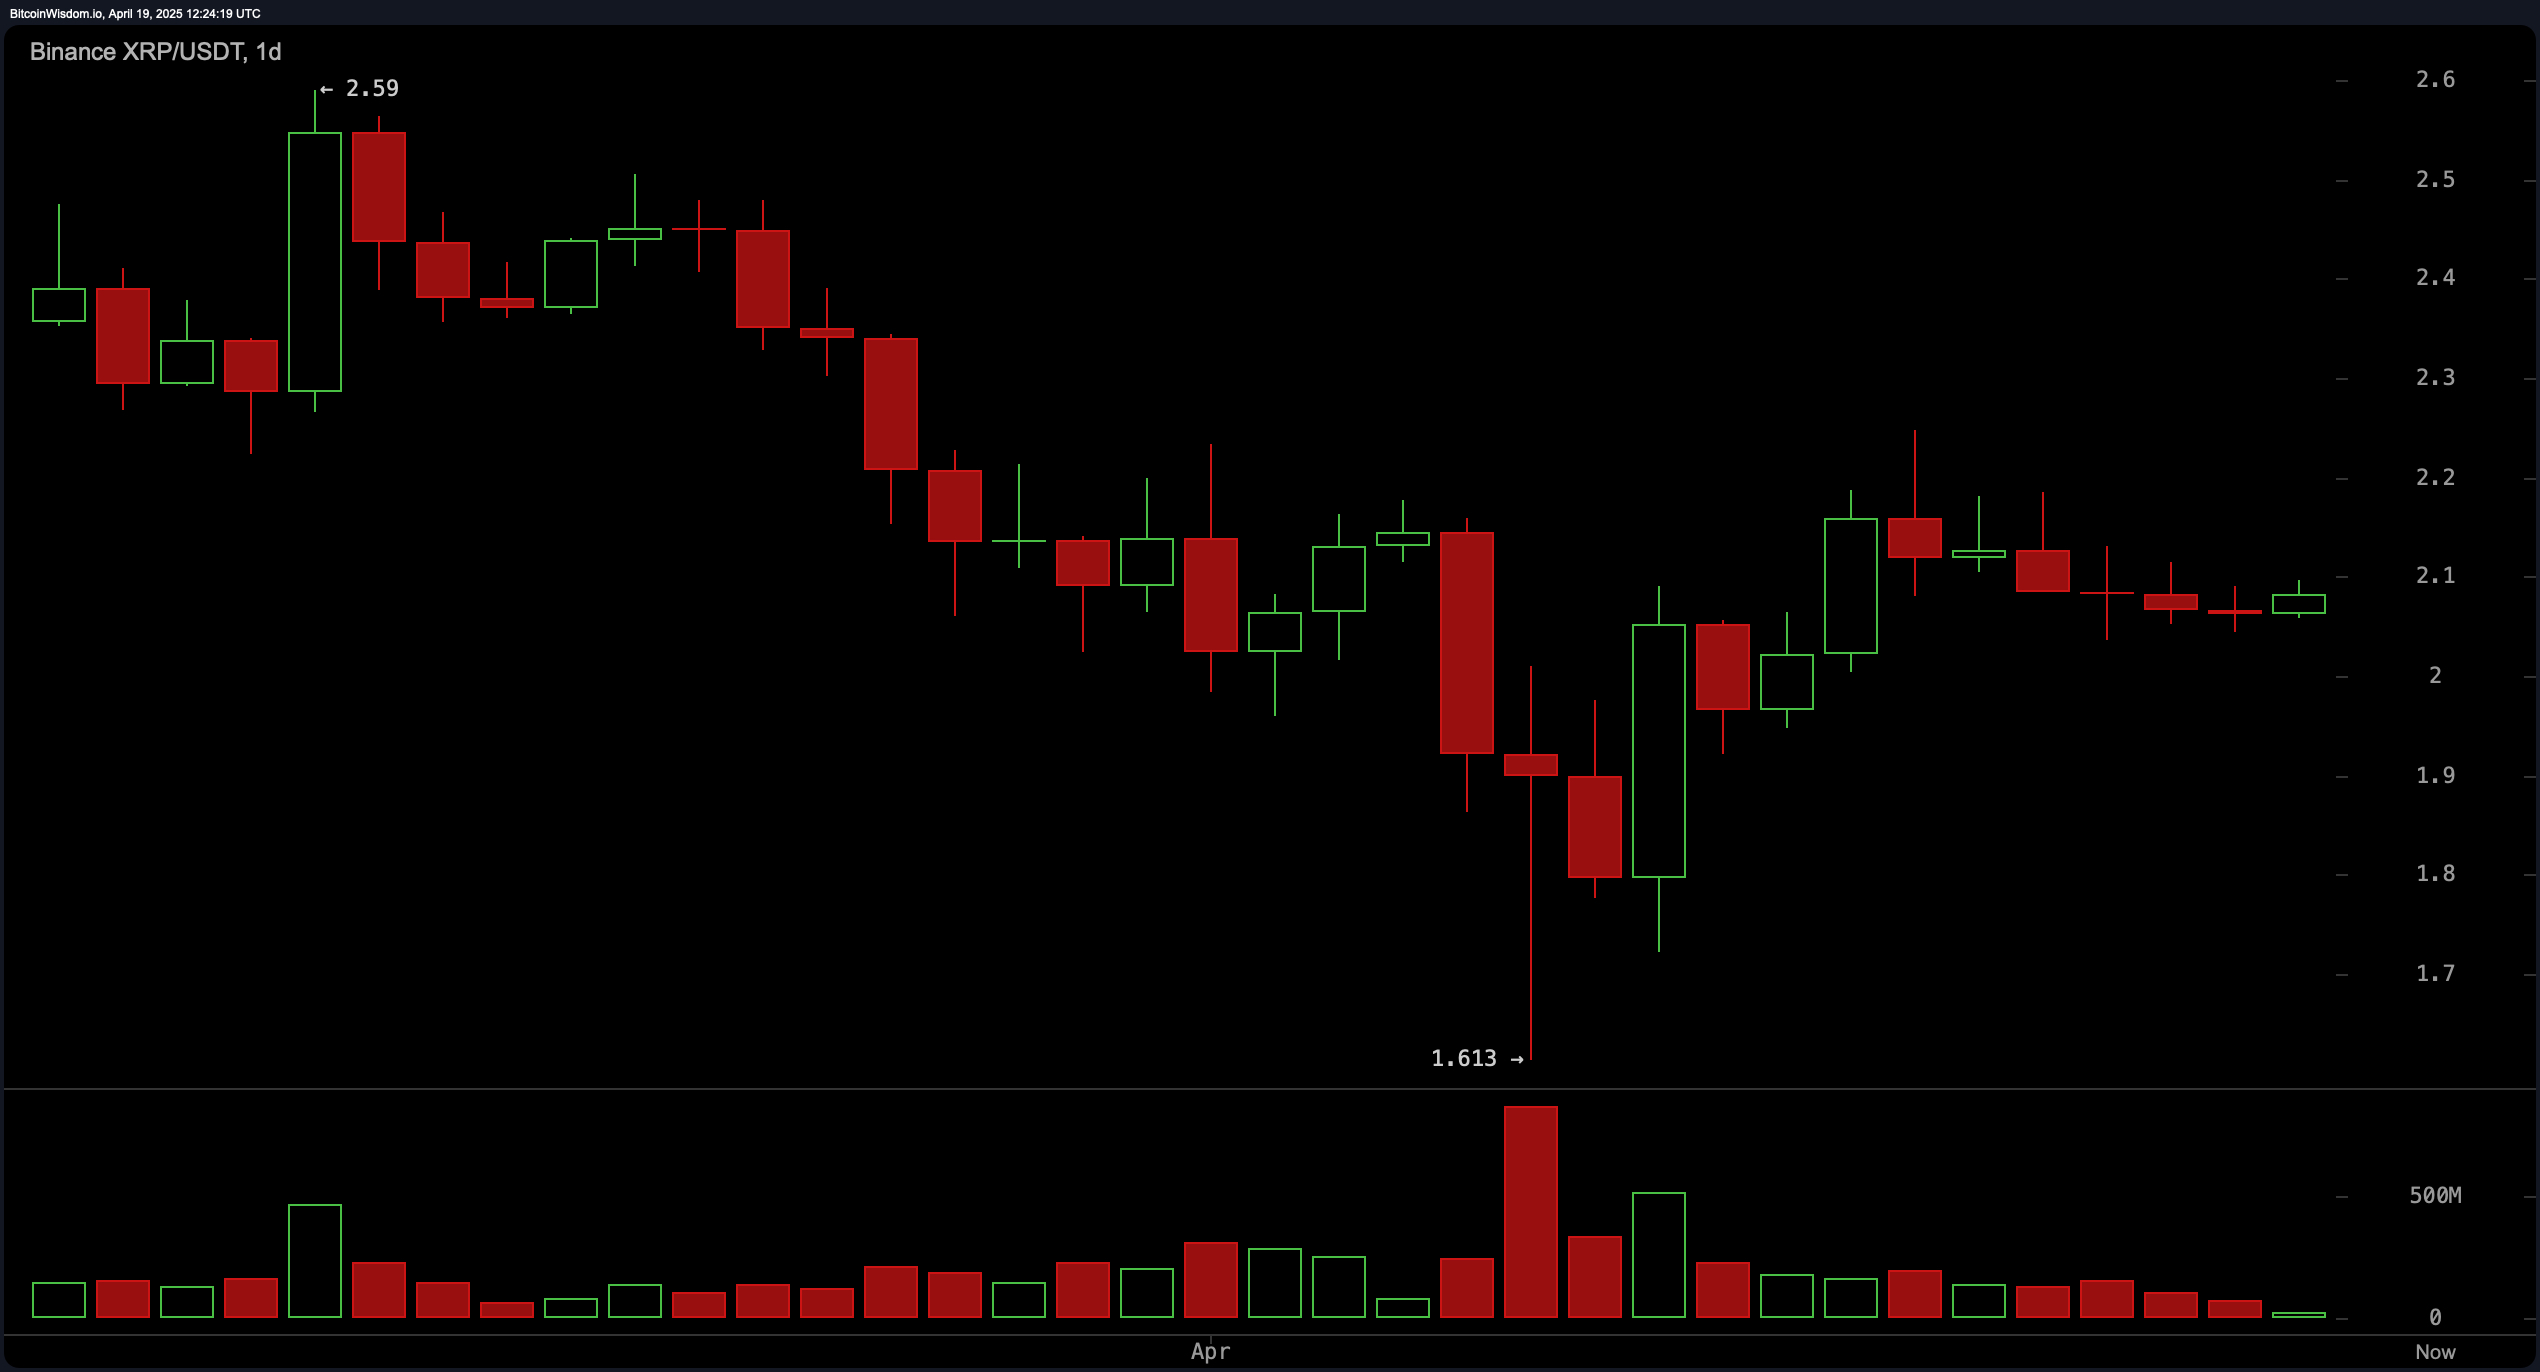
Take a glance at the daily chart, and it’s a different story—sort of. XRP has bounced dramatically from a low of $1.613, creating a V-shaped recovery that would make any trader’s heart race. The peak touched $2.59, only to slip back to the current comfort zone around $2.08. While volume surged during the dip and rebound, the last few sessions have been a quiet, almost serene lull—too calm before the storm? Perhaps. This consolidation suggests that the market is catching its breath, preparing for the next move, but you can’t help but wonder if it will be a grand breakout or a painful breakdown. Keep an eye on $2.10 to the upside or $2.00 to the downside for any decisive action.
Momentum indicators are in neutral territory, clinging to a sense of normalcy. The RSI is sitting comfortably at 47.53, the Stochastic oscillator a cozy 72.30, and the Commodity Channel Index? A calm 26.84. The ADX at 21.08 signals a market struggling to commit, while the Awesome oscillator, sitting at −0.08575, adds a little more gloom. The momentum oscillator? Giving a subtle sell signal at 0.03029, while the MACD (ever the optimist) insists on a buy signal at −0.04377. It’s like the market can’t decide if it’s a bear or a bull, and frankly, neither can we.
Moving averages are a tale of contradictions, of course. The 10-period and 20-period EMAs offer a glimmer of hope at $2.07310 and $2.09532 respectively. But the 30-period EMA at $2.13449 and the bearish-looking 200-period EMA and SMA, positioned at $1.96045 and $1.93327, imply a long-term trajectory that’s less ‘rising star’ and more ‘slow burn.’ This split personality in the moving averages reflects the deep-rooted uncertainty currently clouding XRP’s path.
Bull Verdict:
Despite the heavy mist of ambiguity, there’s some light on the horizon. XRP is holding its ground above key support levels, and with a V-shaped recovery on the daily chart combined with some long-term bullish moving average signals, it’s not all doom and gloom. If the price decisively crosses $2.09 with volume to back it up, there’s a chance for a continued climb towards $2.15—and beyond, but let’s not get ahead of ourselves. Keep your fingers crossed.
Bear Verdict:
Ah, the bearish case—never far behind. Even with a few short-term buy signals, the weakening momentum indicators and wavering moving averages seem to scream ‘exhaustion.’ If $2.06 crumbles and the price heads south, a revisit to the $2.00 mark—or worse, below—becomes a distinct possibility. The bears are waiting, sharpening their claws.
Read More
- 10 Most Anticipated Anime of 2025
- USD MXN PREDICTION
- Brent Oil Forecast
- Pi Network (PI) Price Prediction for 2025
- Silver Rate Forecast
- USD JPY PREDICTION
- USD CNY PREDICTION
- How to Watch 2025 NBA Draft Live Online Without Cable
- Gold Rate Forecast
- Castle Duels tier list – Best Legendary and Epic cards
2025-04-19 16:01